
In tracking the housing recovery, we have followed construction activity with a keen eye as it has lagged behind other key indicators, such as home sales and home prices, but also job growth. That’s because homebuilding is both a signal of where builders feel most confident about future housing demand and where new jobs are being created. In the last year, homebuilding across the country has been ramping up, but it continues to do so at an uneven pace. At first glance, the housing markets that are struggling with tight inventory still appear to remain tight as most of the new construction has focused on multi-family units for the rental market.
So to better understand what’s really going on, we looked at Census building permit data in the 100 largest U.S. metros to find out which homebuilding markets are hot and which are not. To do this, we first projected the level of building activity for all of 2015 based on the data for the first half of 2015. We then compared each metro’s estimated 2015 activity with its own historical annual average level of building permits from 1990 to 2014.
Where New Construction Is Booming: Metro New York
Compared to last year, many of the same housing markets where new construction was highest above normal-New York, Boston, Los Angeles, San Francisco, Houston, Orange County, and Dallas-are still building a lot. The new kids on the block to the top 10 list this year are Philadelphia, Newark, and Seattle, where the increase in permits is at least 50% to 75% higher than their respective historical norm. In fact, 27 of the 100 largest metro areas are now building more than their historical average with the growth in most having picked up markedly.
Among the top 10 U.S. metros where new construction activity is highest above average, metro New York ranks highest with 2.5 times the historical average. We were a little surprised by the number, so we dug a little deeper and found that the construction activity in the New York metro area is very cyclical and has ranged from about 20,000 permits a year to 50,000. Comparing the preliminary permit data for the first six months of 2015 to the same period last year shows an increase of almost 150%. Comparing it to the first half of 2013, it shows a 242% increase. It seems that metro New York today is again reaching a cyclical peak and thus the levels are so much higher than the average. Cyclicality is in the nature of the home building construction and many of the growing markets are on the upward slope of the current cyclical upswing.
| Top 10 Metros Where New Home Construction Is Highest Above Normal | ||||||
| # | U.S. Metro | 2015 annualized permit activity relative to metro historical norm | Year-over-year asking home price change, July 2015 | Multi-unit building share of 2015 permits | 2015 annualized multi-unit permit activity relative to metro historical norm | 2015 annualized single permit activity relative to metro historical norm |
| 1 | New York, NY-NJ | 255% | 6% | 94% | 423% | -50% |
| 2 | Boston, MA | 94% | 5% | 84% | 295% | -50% |
| 3 | Philadelphia, PA | 75% | 4% | 70% | 138% | 5% |
| 4 | Los Angeles, CA | 74% | 12% | 81% | 161% | -44% |
| 5 | Newark, NJ-PA | 71% | 3% | 78% | 290% | -50% |
| 6 | San Francisco, CA | 69% | 18% | 89% | 102% | -36% |
| 7 | Houston, TX | 56% | 20% | 36% | 114% | 60% |
| 8 | Seattle, WA | 56% | 8% | 74% | 153% | -24% |
| 9 | Orange County, CA | 53% | 7% | 67% | 136% | -24% |
| 10 | Dallas, TX | 47% | 12% | 45% | 103% | 30% |
| Sources: Census and Trulia. | ||||||
No Where To Go But Up
Throughout much of the recovery, builders have focused more of their efforts on multi-family homes than constructing single-family homes. So to better understand how hot multi-family construction actually is, we looked at where the share of multi-family buildings has been booming. Turns out, it’s very hot everywhere. Since last year, the share of multi-family buildings has increased in most of the metros that topped last year’s hottest homebuilding markets list.
We then took it a step further and compared the estimated 2015 multi-family permit activity to each metro’s historical norm. In some of the top 10 markets, multi-family construction was higher than the historical norm by several fold. For example, New York’s activity is more than four times higher, while both Boston and Newark are almost three times higher. Even in Dallas and San Francisco where the multi-unit increase was lowest among the top 10, it is still more than double the historical norm. Single-family construction, on the other hand, has been cold. Among the top 10 metros, only three metros had above-average single-family home construction activity, including Houston, Dallas, and Philadelphia, which are markets predominately made up of single-family homes.
Where Homebuilding is Sluggish: Detroit
At the other side of the spectrum are the housing markets where construction activity has not returned to their historical norms. When looking at the housing markets with lowest activity, we only focused on the top 50 of the 100 largest metros to focus on the homebuilding trends in larger markets.
Detroit climbed to the top of the list of the slowest new construction markets with homebuilding activity at two-thirds below historical norms. Last year, Detroit was the second slowest market behind Fort Lauderdale. Other markets that made the list again include Cincinnati, Riverside, and Las Vegas. New comers among the lowest construction activity markets are Milwaukee, Montgomery County-Bucks County-Chester County, PA, Long Island, and West Palm Beach. Riverside and Las Vegas, at 49%, are seeing some improvement in activity relative to normal, but are still growing slowly. In these slower markets, the share of multi-family home building permits is smaller than in the hot markets, and is running well below historical norms.
| Top 10 Metros Where New Home Construction Is Lowest Below Normal | ||||||
| # | U.S. Metro | 2015 annualized permit activity relative to metro historical norm | Year-over-year asking home price change, July 2015 | Multi-unit building share of 2015 permits | 2015 annualized multi-unit permit activity relative to metro historical norm | 2015 annualized single permit activity relative to metro historical norm |
| 1 | Detroit, MI | -65% | 1% | 26% | -70% | -59% |
| 2 | Cincinnati, OH | -57% | 5% | 18% | -65% | -51% |
| 3 | Milwaukee, WI | -53% | 6% | 50% | -45% | -58% |
| 4 | Montgomery County-Bucks County-Chester County, PA | -51% | 3% | 24% | -11% | -61% |
| 5 | Long Island, NY | -51% | 7% | 19% | -48% | -61% |
| 6 | West Palm Beach, FL | -50% | 2% | 26% | -59% | -57% |
| 7 | Riverside–San Bernardino, CA | -49% | 4% | 26% | -6% | -61% |
| 8 | Las Vegas, NV | -49% | 15% | 24% | -59% | -36% |
| 9 | Cleveland, OH | -49% | -2% | 14% | -55% | -45% |
| 10 | Warren–Troy–Farmington Hills, MI | -48% | 0% | 27% | -10% | -53% |
| Note: among the 50 of the 100 largest metros. Sources: Census and Trulia. | ||||||
Home Prices and New Construction Finally in Tandem
Another interesting development over the last year is the positive relationship between construction activity and home prices. Where new construction is booming relative to historical norm is where home prices are on an upward trajectory. The correlation between permit activity relative to historical norms and the year-over-year price change is +0.29, which is modest, but still statistically significant positive relationship. (Remember that correlations range from 1 to -1, where zero means there is no linear relationship.) In other words, builders are generally building where home prices are rising. The positive correlation is a reversal from last year when the relationship between the two measures was negative and builders were not necessarily building where prices were growing.
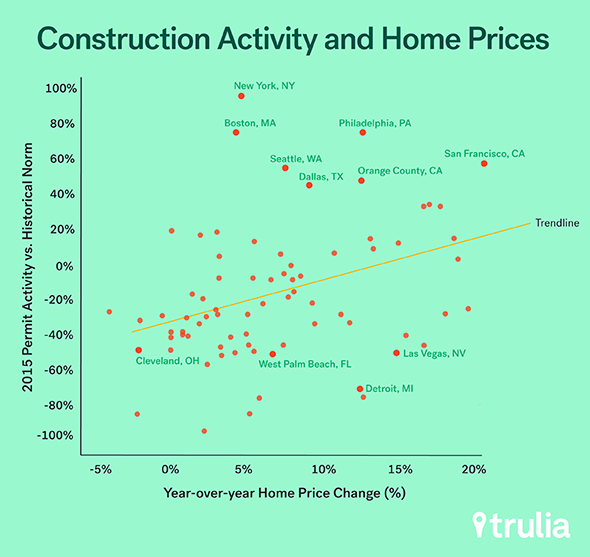
Today, there are generally more markets with building activity above the historical norm. Those markets also tend to be the bigger metro areas where price appreciation remained more robust than in smaller markets. Also, among the colder homebuilding markets, price appreciation is notably slower than last year. Moreover, there is a bigger range in building activity between the hottest markets and coldest markets today than there was last year. That suggests greater polarization between markets where builders are keen on participating in and the markets where they are not.
This brings us to a new connection that we’re seeing in the housing market this year, that between employment growth and construction activity. The correlation between permit activity relative to historical norms and the employment growth since the cyclical bottom is +0.29, which is again a modest, but statistically significant positive relationship.
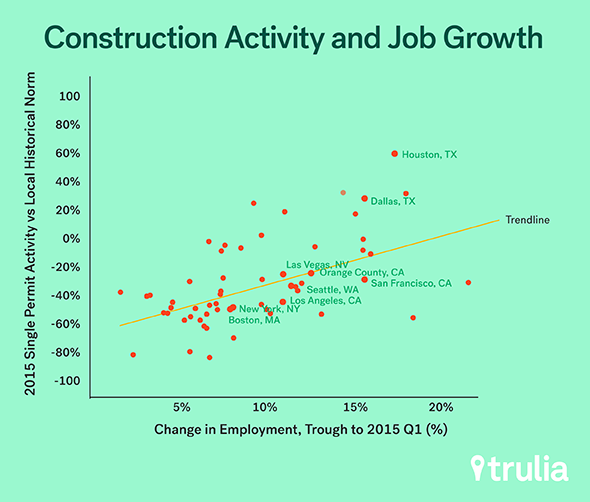
While part of the employment growth is also employment in construction sectors, the scatterplot above also suggests that metros where employment growth has been across a greater number of sectors and robust, we’re also seeing a greater improvement in single-family home construction. In other words, solid and broad-based job market growth is pulling builders back in and giving them confidence to build single-family homes again.
All in all, the housing recovery has reached a new milestone. Builders have become much more bullish on the housing market, with homebuilder confidence haven risen to a near-decade high. New construction is now being driven by steady home price appreciation, but more importantly by stronger economic fundamentals, job growth, and demographic trends which are key fundamentals necessary for a sustainable healthy recovery.

