Most neighborhoods have both renters and homeowners, and that mix depends on the housing stock. Most single‐family homes are owner‐occupied and most multi‐unit buildings are rentals. But there are plenty of exceptions. High‐rise neighborhoods often have both condo owners and apartment renters. And suburban areas with mostly owner‐occupied single‐family homes often have at least a few renters sprinkled in.
Whether renters and owners live together or apart matters for two reasons. First, when every neighborhood has both renters and owners, the choice of which neighborhood to live in isn’t limited by whether you rent or buy. But in a city where neighborhoods tend to be renter‐only or owner‐only, your choices are limited. In particular, people who can’t afford to buy a home have fewer neighborhoods to choose from when looking for a rental. Second, people care who their neighbors are. That’s especially true for homeowners. When they’re asked what’s important to them about their neighbors, they say they care most about whether the people who live near them are also homeowners, according to a September 2013 Trulia survey.
Renters and homeowners are more integrated—which is to say less segregated—in some metros than in others. But overall segregation dropped between 2000 and 2010, mostly because the housing bust turned some single‐family homes in predominately owner‐occupied neighborhoods into rentals.
Where Renters and Owners Mix – And Where They Don’t
To analyze how integrated or segregated renters and owners are in different metros, we used what’s called a dissimilarity index, which is a measure of how evenly two distinct groups are distributed across a geographic area. For each metro area, this index ranges from 0 to 1:
- 0 indicates a completely integrated metro that has the same mix of renters and owners in every neighborhood.
- 1 indicates a completely segregated metro where every neighborhood is either all owners or all renters.
The index equals the percentage of owners or renters in a metro that would have to move to a different neighborhood for all neighborhoods to have the same mix of owners and renters. (Throughout this post, “neighborhood” means Census tract. See note below.)
Among the 100 largest U.S. metros, the top four where renters and owners are most integrated are in
Florida. In the top three—Lakeland‐Winter Haven; North Port‐Bradenton‐Sarasota; and Palm Bay-Melbourne‐Titusville—fewer than 30% of households would have to move to equalize the mix of owners and renters across all neighborhoods. Overall, the 10 metros where renters and owners are most integrated tend to be in the Sunbelt.
| Top 10 Metros Where Owners and Renters are Most Integrated | ||
| # | U.S. Metro | Dissimilarity index of owners vs. renters |
| 1 | Lakeland‐Winter Haven, FL | 0.28 |
| 2 | North Port‐Bradenton‐Sarasota, FL | 0.29 |
| 3 | Palm Bay‐Melbourne‐Titusville, FL | 0.29 |
| 4 | Cape Coral‐Fort Myers, FL | 0.31 |
| 5 | Bakersfield, CA | 0.32 |
| 6 | Dayton, OH | 0.32 |
| 7 | Jacksonville, FL | 0.32 |
| 8 | Little Rock, AR | 0.32 |
| 9 | Charleston, SC | 0.33 |
| 10 | Greenville, SC | 0.33 |
| Note: among 100 largest metros. The dissimilarity index ranges from 0 to 1. A lower dissimilarity index means owners and renters are more integrated (i.e. less segregated). | ||
The large metros where owners and renters are most segregated are clustered in the Northeast and Texas. Eight of the 10 most segregated metros are within a three‐hour train ride of New York City. Newark, NJ is the most segregated. In fact, more than half of the households living there would have to move to a different neighborhood in order to equalize the mix of renters and owners across neighborhoods.
| Top 10 Metros Where Owners and Renters are Most Segregated | ||
| # | U.S. Metro | Dissimilarity index of owners vs. renters |
| 1 | Newark, NJ‐PA | 0.53 |
| 2 | Fairfield County, CT | 0.48 |
| 3 | Dallas, TX | 0.47 |
| 4 | New York, NY‐NJ | 0.47 |
| 5 | New Haven, CT | 0.46 |
| 6 | Hartford, CT | 0.46 |
| 7 | Bethesda‐Rockville‐Frederick, MD | 0.46 |
| 8 | Washington, DC‐VA‐MD‐WV | 0.46 |
| 9 | Edison‐New Brunswick, NJ | 0.46 |
| 10 | Austin, TX | 0.45 |
| Note: among 100 largest metros. The dissimilarity index ranges from 0 to 1. A higher dissimilarity index means owners and renters are less integrated (i.e. more segregated). | ||
Looking across all metros, owners and renters are more likely to be integrated in smaller, lower population‐density places. Owner‐renter integration is also higher in vacation areas. Among smaller metros—those ranked 101 to 250 in population—renters and owners are most integrated in two popular vacation areas: Hilo, HI (dissimilarity index of 0.19) and Lake Havasu City‐Kingman, AZ (0.21). In contrast, owners and renters are most separate in college towns because off‐campus student rental housing is often clustered in particular neighborhoods. (Dormitory residents aren’t considered households and are therefore excluded from this analysis.) The most segregated smaller metros are Ann Arbor, MI (0.53); Gainesville, FL (0.53); and College Station–Bryan, TX (0.50)—all of which are college towns.
The Housing Bust Brought Renters and Owners Closer Together
In 70 of the 100 largest U.S. metros, the dissimilarity index fell between 2000 and 2010, which is to say renters and owners became more integrated. Integration increased most in Las Vegas, Phoenix, and North Port‐Bradenton‐Sarasota, FL—metros where home prices fell 50% or more during the housing bust. In fact, between 2000 and 2010, the change in renter‐owner integration was strongly correlated with the severity of the housing bust.
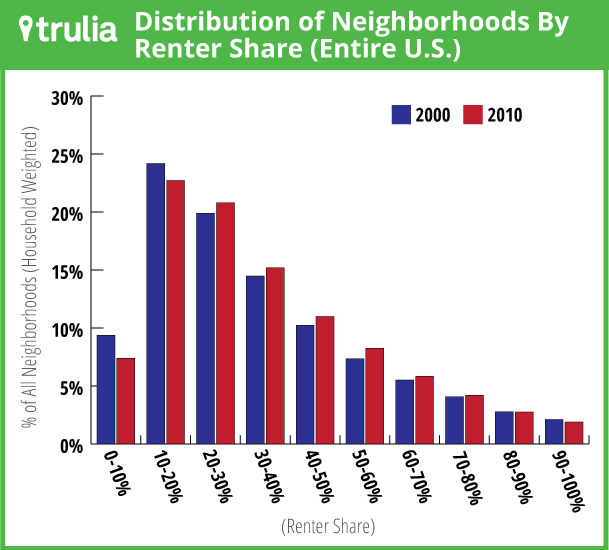
The housing bust and foreclosure crisis led to an overall shift from owning to renting and a decline in the homeownership rate. This shift affected renter‐owner integration primarily because many foreclosed homes were bought up by investors and rented out. As a result, fewer neighborhoods were overwhelmingly owner‐occupied in 2010 than they were in 2000. To see this, we looked at the distribution of neighborhoods by renter share (weighted by neighborhood household count). For the U.S. overall, the share of neighborhoods that were nearly all owner‐occupied (i.e., 0‐10% renters) dropped from 9.4% in 2000 to 7.4% in 2010. At the same time though, the share of overwhelmingly rental neighborhoods (i.e., 90‐100% renters) didn’t increase. Rather, the share of more evenly mixed neighborhoods increased.

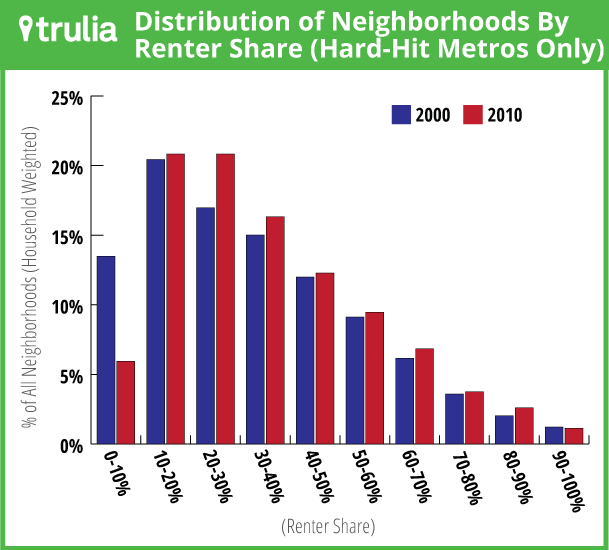
When we look at the metros hit hardest by the housing bust, it’s clear that the foreclosure crisis had the biggest impact on traditionally owner‐occupied neighborhoods. In the 15 large metros where home prices fell at least 40% from peak to trough, the share of neighborhoods that were nearly all owneroccupied (i.e., 0‐10% renters) dropped from 13.5% in 2000 to 5.9% in 2010. In other words, the likelihood of living in a neighborhood with very few renters dropped by more than half in hard‐hit metros.

Thus, the housing bust reduced the segregation of owners and renters. Integration increased the most in housing markets with severe price declines, a worse foreclosure crisis, and bigger increases in single-family rentals. As a result, neighborhoods with a renter share below 10% became rarer, especially in hard‐hit metros. That’s good news for people who have been shut out of homeownership. They can now find rentals in more neighborhoods than they could before the bust. But for homeowners who want other homeowners as neighbors, it’s gotten harder to find neighborhoods that are nearly renter‐free.
Note: the dissimilarity index is calculated for each metro based on the renter‐owner mix in all Census tracts within that metro. The data come from the 2000 and 2010 decennial Census. The 2008‐2012 American Community Survey also reports owner and renter households by Census tract, but covers five years that on average are no more current than the 2010 decennial Census. Furthermore, the ACS is a sample, while the decennial Census is a complete count of households.
Dissimilarity indexes can be used to measure the integration or segregation of any two distinct groups and are often used in research about racial segregation. For formulas and discussion of dissimilarity indexes and other measures of integration or segregation, see here and here.

