Three years ago, we explored how the housing market fared in the gayest neighborhoods across the country. One of the most interesting findings from that report was that gay men tended to live in more expensive ZIP codes than gay women, even when looking at ZIPs within the same metro. In honor of Gay Pride this year, we wanted to revisit these neighborhoods and find out what’s changed since 2012.
To do this, we calculated the share of households that are same-sex male couples and same-sex female couples in every ZIP code in America using the 2010 Census (see note below on how we did this). Focusing on just the top 10 ZIPs with the highest concentration of same-sex male and same-sex female couples, we then calculated the median price per foot of homes for sale in each ZIP code on Trulia as of June 1, 2015 and compared it to June 1, 2012 to find out how prices have changed, both over time and relative to their metropolitan area.
Home Prices Higher and Growing Faster Where Gay Men Live
In June of 2012, homes in gay men neighborhoods cost $188 per square foot, which is $55 more expensive than in gay women neighborhoods. Since then, gay men neighborhoods have gone on a tear – becoming $81 per square foot more expensive.
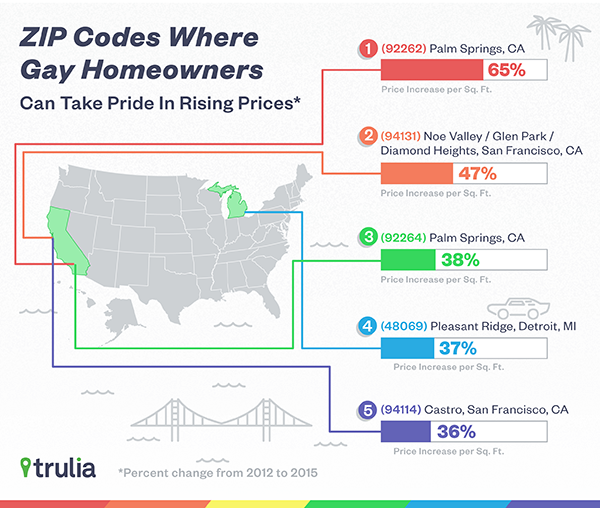
Over the last three years, home prices in gay men neighborhoods have grown by an average of 23%. Of course, this figures mask changes in individual neighborhoods, so here’s a look at where prices have risen the most.
| Where Gay Men Neighborhoods Are Getting More Expensive | ||||
| # | ZIP Code | Median Price Per Foot, Jun 2012 | Median Price Per Foot, Jun 2015 | % Change Price Per Foot, Jun 2012-Jun 2015 |
| 1 | 92262: Palm Springs, CA | $158 | $260 | 65% |
| 2 | 94131: Noe Valley / Glen Park / Diamond Heights, San Francisco, CA | $522 | $768 | 47% |
| 3 | 92264: Palm Springs, CA | $174 | $240 | 38% |
| 4 | 48069: Pleasant Ridge, suburban Detroit, MI | $137 | $188 | 37% |
| 5 | 94114: Castro, San Francisco, CA | $699 | $948 | 36% |
| 6 | 90069: West Hollywood, Los Angeles, CA | $611 | $802 | 31% |
| 7 | 75219: Oak Lawn, Dallas, TX | $185 | $225 | 22% |
| 8 | 33305: Wilton Manors, Fort Lauderdale, FL | $249 | $292 | 17% |
| 9 | 19971: Rehoboth Beach, DE | $193 | $203 | 5% |
| 10 | 02657: Provincetown, Cape Cod, MA | $604 | $616 | 2% |
| Average for all Gay Men Neighborhoods | $188 | $238 | 23% | |
| Note: Only zip codes with at least 1000 persons are included in the analysis. Average growth rate is weighted by number of gay households, so the listed percentage increase is different than the simple percentage change between average price per foot in 2012 and 2015. Data in this report are different from our report in June 2012 because of new MSA definitions and observed time period of listings (month vs. previous year in the June 2012 report) | ||||
| Where Gay Women Neighborhoods Are Getting More Expensive | ||||
| # | ZIP Code | Median Price Per Foot, June 2012 | Median Price Per Foot, June 2015 | % Change Price Per Foot, June 2012-June 2015 |
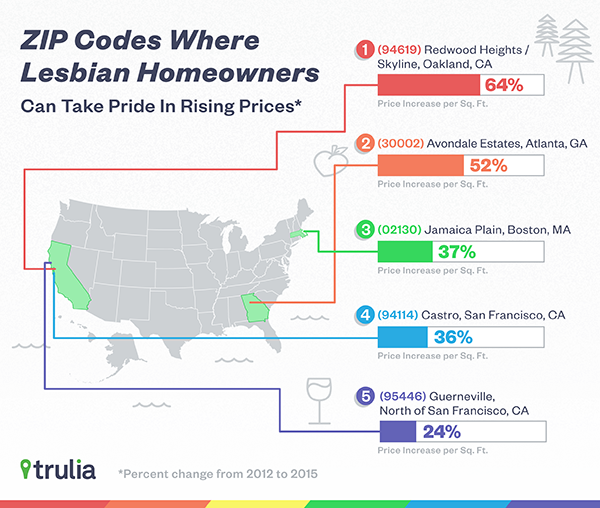
| 1 | 94619: Redwood Heights / Skyline, Oakland, CA | $237 | $389 | 64% |
| 2 | 30002: Avondale Estates, suburban Atlanta, GA | $114 | $173 | 52% |
| 3 | 02130: Jamaica Plain, Boston, MA | $303 | $414 | 37% |
| 4 | 94114: Castro, San Francisco, CA | $699 | $948 | 36% |
| 5 | 95446: Guerneville, north of San Francisco, CA | $270 | $335 | 24% |
| 6 | 01060: Northampton, MA | $197 | $216 | 10% |
| 7 | 19971: Rehoboth Beach, DE | $193 | $203 | 5% |
| 8 | 01062: Northampton, MA | $190 | $196 | 3% |
| 9 | 02657: Provincetown, Cape Cod, MA | $604 | $616 | 2% |
| 10 | 02667: Wellfleet, Cape Cod, MA | $326 | $323 | -1% |
| Average for all gay women neighborhoods | $133 | $157 | 18% | |
| Note: Only zip codes with at least 1000 persons are included in the analysis. Average growth rate is weighted by number of gay households, so the listed percentage increase is different than the simple percentage change between average price per foot in 2012 and 2015. Data in this report are different from our report in June 2012 because of new MSA definitions and observed time period of listings (month vs. previous year in the June 2012 report) | ||||
Home Price Growth Outpaces Metro Area Where Gay Women Live
Several gayborhoods are located in expensive metros that have also experienced sharp price gains in the last few years, such as San Francisco and Boston. So it could be that rising home prices in these neighborhoods are driven by price changes in their respective housing market, rather than the demand to live in gayborhoods themselves. To tease out these neighborhood-level effects, we’ve compared prices in these gayborhoods with their respective metro areas.
As it turns out, home prices in almost all of the gayborhoods that we look at in this study are more expensive than their metros as a whole. For example, homes in the Castro neighborhood of San Francisco cost $948 per square foot – which is 34% more expensive than the San Francisco metro area ($705 per square foot), while places like West Hollywood, CA and Provincetown, MA are 123% and 119% more expensive, respectively. The only gayborhood that isn’t more expensive than its respective metro is Guerneville, north of San Francisco, CA, which is only 2% cheaper per square foot than its metro area.
|
Home Prices in Gay Men Neighborhoods vs. Wider Metro Area |
|||||
| # | ZIP Code | Median Price Per Foot,Jun 2015 | Median Price Per Foot of Metro,Jun 2015 | Gayborhood Premium, Jun 2015 | Difference in Price Per Foot Growth Relative to Metro, Jun 2012 – Jun 2015 |
| 1 | 92262: Palm Springs, CA | $260 | $173 | 50% | 13% points |
| 2 | 19971: Rehoboth Beach, DE | $203 | $153 | 33% | 5% points |
| 3 | 94131: Noe Valley / Glen Park / Diamond Heights, San Francisco, CA | $768 | $705 | 9% | -1% points |
| 4 | 48069: Pleasant Ridge, suburban Detroit, MI | $188 | $122 | 54% | -6% points |
| 5 | 33305: Wilton Manors, Fort Lauderdale, FL | $292 | $158 | 85% | -10% points |
| 6 | 92264: Palm Springs, CA | $240 | $173 | 39% | -12% points |
| 7 | 75219: Oak Lawn, Dallas, TX | $225 | $119 | 89% | -12% points |
| 8 | 94114: Castro,San Francisco, CA | $948 | $705 | 34% | -13% points |
| 9 | 02657: Provincetown, Cape Cod, MA | $616 | $281 | 119% | -19% points |
| 10 | 90069: West Hollywood, Los Angeles, CA | $802 | $360 | 123% | -26% points |
Interestingly, when we compare price growth in these neighborhoods to their metro area, gay women neighborhoods have outperformed their gay men neighborhood counterparts. Even though neighborhoods with the most gay men are more expensive, a larger number of gay women neighborhoods (six) have outpaced their metro areas than gay men neighborhoods (two). And not only have prices in more gay women neighborhoods grown faster than their metro, they have grown by a larger amount.
For example, prices in gay women neighborhoods like Avondale Estates in Atlanta, Jamaica Plain in Boston, and Northampton in West Massachusetts have grown 35%, 28%, and 11% points faster than their metro area. On the other hand, the top two fastest growing gay men neighborhoods have only grown 13% (Palm Springs, CA) and 5% (Rehoboth Beach, DE) points faster than their metro, and the third (Noe Valley / Glen Park / Diamond Heights, San Francisco, CA) actually lost one percentage point.
|
Home Prices in Gay Women Neighborhoods vs. Wider Metro Area |
|||||
| # | ZIP Code | Median Price Per Foot,Jun 2015 | Median Price Per Foot of Metro,Jun 2015 | Gayborhood Premium, Jun 2015 | Difference in Price Per Foot Growth Relative to Metro,Jun 2012-Jun 2015 |
| 1 | 30002: Avondale Estates, suburban Atlanta, GA | $173 | $96 | 80% | 35% points |
| 2 | 02130: Jamaica Plain, Boston, MA | $414 | $243 | 70% | 28% points |
| 3 | 01060: Northampton, MA | $216 | $140 | 55% | 11% points |
| 4 | 94619: Redwood Heights /Skyline, Oakland, CA | $389 | $373 | 4% | 7% points |
| 5 | 19971: Rehoboth Beach, DE | $203 | $153 | 33% | 5% points |
| 6 | 01062: Northampton, MA | $196 | $140 | 41% | 1% points |
| 7 | 94114: Castro,San Francisco, CA | $948 | $705 | 34% | -13% points |
| 8 | 02667: Wellfleet,Cape Cod, MA | $323 | $281 | 15% | -13% points |
| 9 | 95446: Guerneville,north of San Francisco, CA | $335 | $341 | -2% | -18% points |
| 10 | 02657: Provincetown,Cape Cod, MA | $616 | $281 | 119% | -19% points |
So why the discrepancy in price growth between same-sex male and female neighborhoods? A couple of reasons. First, the top gay men neighborhoods are places where prices were already high relative to their metros, and thus were not hit as hard during the housing crash as other less expensive neighborhoods within their respective metros. Second, gay women couples are 2.4X as likely to have children than gay men couples, so it could be that gay women seek up-and-coming neighborhoods with good schools to raise their children. Nonetheless, all of these neighborhoods are likely to be full of pride during the month of June, and not just because of strong price gains.
(The fine print: The Census doesn’t ask sexual orientation, of course, so the only way to measure gay neighborhoods is based on where couples live. The Census data requires some corrections and adjustments, described here. Finally, ZIP codes don’t line up perfectly with neighborhoods, but we did our best to use the closest neighborhood names that correspond to the ZIP codes in our analysis.)

