When it’s time to sell a home, sellers might be tempted to cut out an agent and the typical 6% commission that comes with them. When it comes to actually listing the home, we find for-sale-by-owner (FSBO) sellers are slightly more optimistic about the value of their home and list their homes at a 2% premium nationally. This sounds like great news for sellers, but there is a risk: FSBOs often see their homes sit on the market longer than agent-listed homes, sometimes by more than a month.
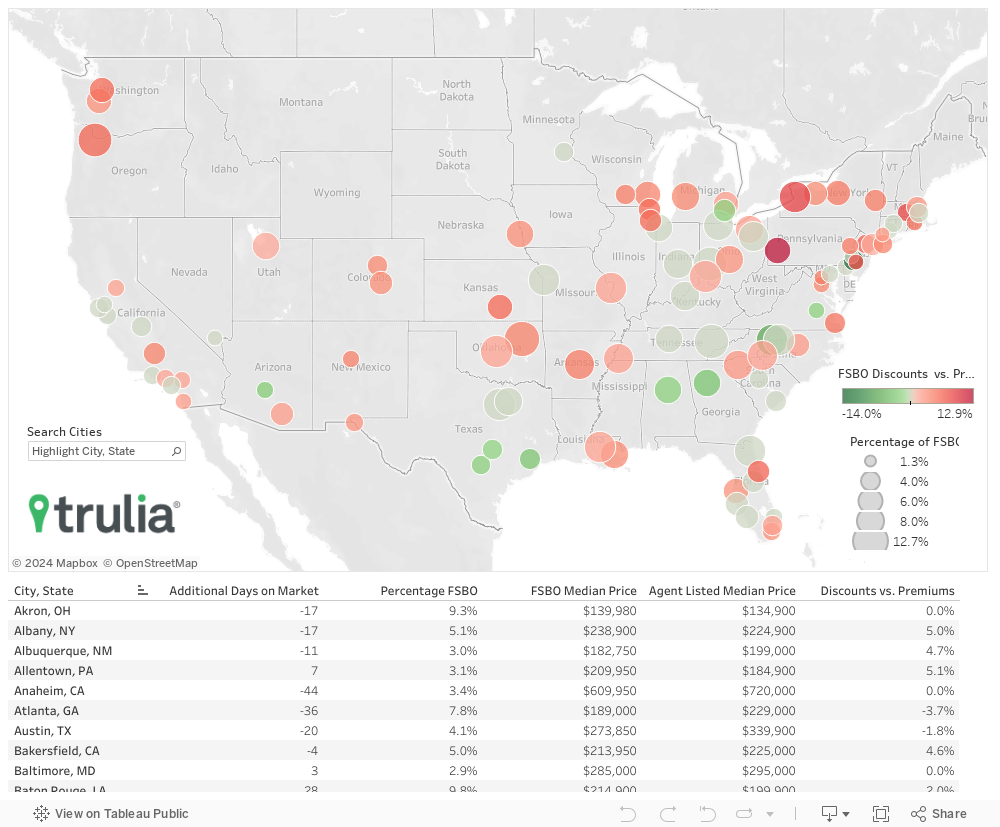
We examined Trulia listing data to determine where FSBO listings are more common, if they differ from agent-listed properties in price, and how long they’re on the market. Nationally, we find that FSBOs are listed about 2% more than a similar home listed by an agent and that they sometimes sit on the market longer than agent-listed homes. Furthermore, we find:
- Nationally, 6.2% of all listings are for sale by owner. Tulsa, Okla., has the most FSBO listings, 12.7%, as a share of all homes for sale. Honolulu has the fewest (1.3%). The median FSBO size is only 23 square feet smaller than an agent-listed home, and 2 years older.
- The largest positive difference in listing price for a FSBO is in Pittsburgh, where a comparable FSBO home is listed at a 12.9% premium to an agent-listed home. The median listing price of FSBOs in Pittsburgh is $147,250, and the median price of an agent-listed property is $149,900
- Philadelphia is where there’s the largest negative difference in FSBO listing prices, at -14%. The median listing price of FSBOs in Philadelphia is $111,900, while the median listing price of an agent listed property is $205,000.
Where Do FSBOs Flock or Flee?
The highest percentage of FSBOs in any market is in Tulsa at 12.7% of all listings. Tulsa, at 4.6%, ranks 21st among the 100 biggest housing markets when it comes to the premium FSBO sellers are asking for above agent-listed homes. Like Tulsa, the metros with the biggest shares of FSBO-listed homes are located in middle of the country. Only two metros of the 10 biggest FSBO markets are located on the coasts, Portland, Ore., and Buffalo, N.Y. Honolulu has the lowest proportion of FSBOs in any market. Only 1.3% of all homes in Honolulu are listed as FSBOs. The coasts tend to see the least amount of FSBO-listed homes in their markets, with nine out of the 10 smallest FSBO markets being located on the East and West coasts. The only non-coastal market is Las Vegas.
| Share of FSBO Listings | |
| FEWEST FSBO LISTINGS AS A SHARE OF THE MARKET | |
| Metro | Percentage FSBO |
| Urban Honolulu, HI | 1.3% |
| Bridgeport-Stamford-Norwalk, CT | 2.1% |
| Montgomery County-Bucks County-Chester County, PA | 2.3% |
| Silver Spring-Frederick-Rockville, MD | 2.3% |
| Camden, NJ | 2.4% |
| Las Vegas-Henderson-Paradise, NV | 2.5% |
| New Haven-Milford, CT | 2.6% |
| Providence-Warwick, RI-MA | 2.6% |
| San Diego-Carlsbad, CA | 2.8% |
| Richmond, VA | 2.8% |
| MOST FSBO LISTINGS AS A SHARE OF THE MARKET | |
| Buffalo-Cheektowaga-Niagara Falls, NY | 10.0% |
| Winston-Salem, NC | 10.0% |
| St. Louis, MO-IL | 10.0% |
| Oklahoma City, OK | 10.6% |
| Fort Worth-Arlington, TX | 10.7% |
| Cincinnati, OH-KY-IN | 11.0% |
| Dayton, OH | 11.2% |
| Portland-Vancouver-Hillsboro, OR-WA | 11.6% |
| Knoxville, TN | 12.1% |
| Tulsa, OK | 12.7% |
We found 34 of the 100 metros we looked at had no significant difference in price between FSBO and for sale by agent. Of the 66 remaining metros, only 10 showed FSBO listings at lower than agent-listed homes. FSBOs carry the highest premiums to agent-listed homes the East Coast. The top six markets for FSBOs are all located along the East Coast, and five of those are located in the Northeast, with the sixth being Daytona Beach, Fla. FSBOs tend to be most undervalued in the South and Southwest. Of the 10 metros where FSBOs are listed below agent-listed properties, three are in Texas and one is in Arizona. Outside the Southwest, Georgia, and Alabama each have FSBO listings that have a discount to the market.
| FSBO Prices vs. Market Medians | |||
| Metro | Projected FSBO Listing Difference | Market Median Price | FSBO Median Price |
| Pittsburgh, PA | 12.9% | $149,900 | $147,250 |
| Buffalo-Cheektowaga-Niagara Falls, NY | 9.2% | $141,700 | $164,900 |
| Worcester, MA-CT | 8.9% | $254,900 | $288,000 |
| Camden, NJ | 8.0% | $189,900 | $220,000 |
| Newark, NJ-PA | 7.0% | $359,000 | $410,000 |
| Deltona-Daytona Beach-Ormond Beach, FL | 6.8% | $210,000 | $210,000 |
| Portland-Vancouver-Hillsboro, OR-WA | 6.7% | $379,900 | $325,000 |
| Wichita, KS | 6.3% | $141,000 | $149,900 |
| Chicago-Naperville-Arlington Heights, IL | 6.2% | $259,538 | $245,000 |
| Seattle-Bellevue-Everett, WA | 6.2% | $434,950 | $429,000 |
| Austin-Round Rock, TX | -1.8% | $339,900 | $273,850 |
| Detroit-Dearborn-Livonia, MI | -1.9% | $99,900 | $99,500 |
| Richmond, VA | -2.0% | $239,950 | $230,000 |
| Birmingham-Hoover, AL | -2.2% | $179,900 | $187,900 |
| San Antonio-New Braunfels, TX | -2.4% | $220,000 | $179,900 |
| Phoenix-Mesa-Scottsdale, AZ | -2.9% | $259,000 | $235,000 |
| Houston-The Woodlands-Sugar Land, TX | -3.5% | $279,500 | $169,000 |
| Atlanta-Sandy Springs-Roswell, GA | -3.7% | $229,000 | $189,000 |
| Winston-Salem, NC | -6.7% | $164,900 | $148,500 |
| Philadelphia, PA | -14.0% | $205,000 | $111,900 |
How long a FSBO home stays on market depends on the market. In Los Angeles and Houston FSBOs are on the market for just over 40 days less than the average agent-listed home. On the other hand, in Detroit FSBOs stay on the market for 36 days longer than normal. Rochester, N.Y., and Baton Rouge, La., are close behind, FSBO homes there spend 28 extra days on the market. These values were not analyzed for their statistical significance, so the variation cannot be attributed to whether a listing is a FSBO or not.
Agents List at a Higher Price in Hotter Markets
In America’s biggest markets, FSBOs tend to be listed more in line with market price, or below market price. Three of the ten metros we found where FSBOs to be listed lower than market value are in the 10 largest metros. Atlanta, Houston and Phoenix stand out as notable large metros where FSBOs list significantly lower than agent-sold homes. Only in Chicago and Washington are FSBOs listed at more than 2% over agent-listed properties in the top 10 biggest housing markets. Even though a FSBO is listed below an agent listed property, there’s still a good chance a FSBO is can make more money when you consider agent commissions. In only 2 markets, Philadelphia and Winston-Salem, N.C., are FSBOs listed lower than 6% below market price, the market standard for agent commissions. That said, while sellers may go it alone, buyers are likely to come armed with an agent, who normally will charge a 3% commission. Looking at markets where FSBOs are listed at least 3% below market rate, we can add Houston and Atlanta to the list of metros where for FSBO asking prices don’t offer much value.
Is it worth it?
Ultimately, it’s not unreasonable for sellers to consider a FSBO listing considering the potential payoff. But it’s important to remember the value agents bring to the table. They have access to more listings and buyers, know a market’s ins and outs, and have experience negotiating a deal – and let’s be honest, homebuying can be a fretful experience full of snags and bumps. Moreover, agents have access to resources: home stagers, lenders, home inspectors and legal help. Agents also know what marketing approach works in a market. The bottom line: it’s good to have a pro on your side. Perhaps even more importantly, agents know that a listed price is just a starting point. In some markets, San Jose, Calif., for instance, properties can be priced lower to start bidding wars. FSBOs also run the risk of under pricing their homes. Our findings suggest that FSBO properties run the risk of languishing – perhaps due to the inexperience of the seller in finding and negotiating with a potential buyer. Again, our research is informative only. Knowing the landscape for FSBOs in your market is important if you’re considering selling your home.
Methodology
We used Trulia listings data to take a look at for-sale-by-owner and for-sale-by-agent properties, noting the date they come on the market and when they drop off the market. We looked at single-family homes and condos listed as “For Sale” or “For Sale By Owner.” This listing data was collected from the fourth quarter of 2015, all of 2016, and 2017 through Aug. 7. We used the listing price from the last day on market for our price calculations. The following regression was used to calculate the percentage changes in price: ln(price)=b0+b1*ln(number of bedrooms)+b2*ln(number of bathrooms)+b3*ln(square feet)+b4*ln(year built)+b5*(FSBO dummy variable)+factor(zipcode). Trulia uses the Census defined metropolitan divisions where available; otherwise, we follow the metropolitan statistical area definitions.
A regression analysis is a statistical model that isolates individual impacts on a data point, in this case listing price, while controlling for other potential influences like home characteristics and geography. The regression analysis we used to calculate the % change in listing price if a listing is a FSBO or not is important in isolating the impact of being a FSBO. Looking only at the differences in median home prices, it might seem like FSBOs are significantly lower priced in most markets, but that’s not necessarily the case. While the median prices of homes may differ, it’s not necessarily because the homes are FSBOs, as home characteristics of the average FSBOs might deviate from an average home’s characteristics? Our results account for this, so a percentage change for a FSBO is the percentage being compared to how a completely identical home in the same location would have listed otherwise.

