We’ve all known folks like this. And a few of us are those people. These are the ones who found their “forever house”. They’ve ridden the area’s economic ups and downs and seen neighbors come and go. Many of them have ridden out natural disasters and repaired and rebuilt. Through it all, they’ve been there. But where exactly is “there,” that is, the places where people like this are concentrated?
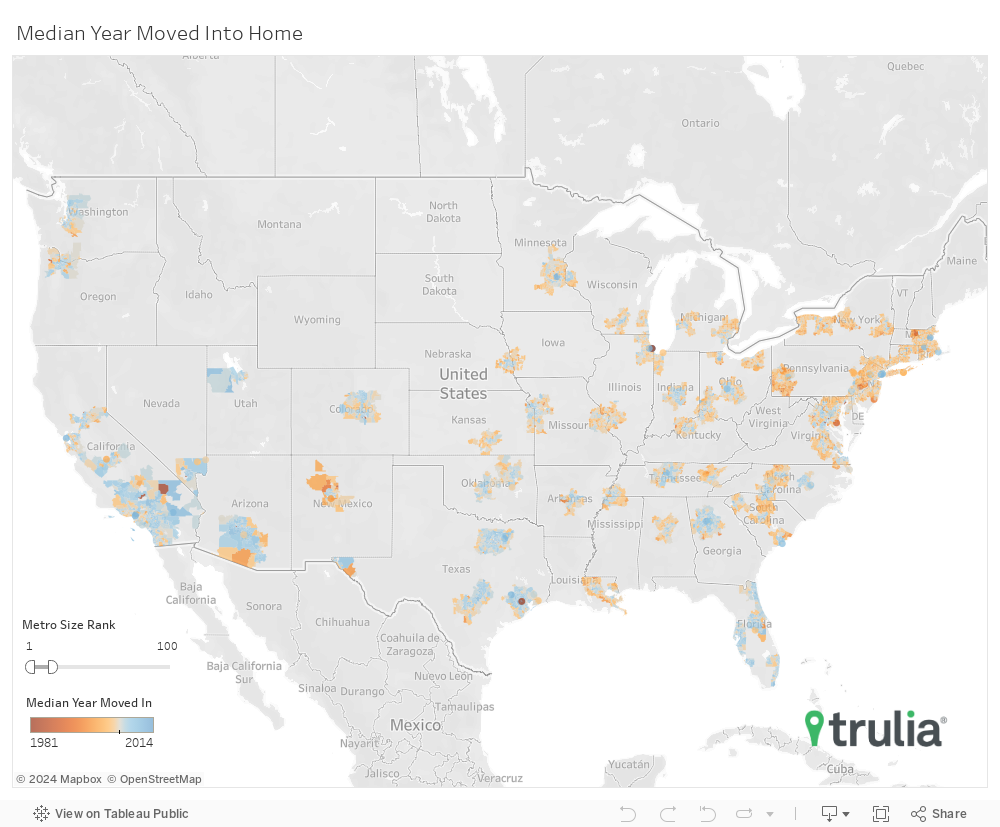
To answer that question, we analyzed and mapped the median move-in date for residents across the country at the ZIP code level. As you might expect, a lot of places with lots of long-time residents have a higher-than-average home ownership rate, as renters tend to move more often. For that reason, most of the places with householders who have lived in the same place longest are far from urban cores. Looking more broadly, the data also shows a clear pattern of demographic trends over the past 35 years. There are some notable exceptions to both these generalizations though. Looking just at ZIP codes in the largest 100 metro areas, here are some of the highlights we noticed:
- The median move-in year in more rural areas is 2004, the oldest in our sample. This compares with a median move-in year of 2006 in suburban areas and 2007 in urban areas.
- Looking at the “oldest” 10% of ZIP codes by metro area, rural ZIP codes are overrepresented by 54.7%, while suburban and urban ZIP codes are 35.4% and 70.3% underrepresented respectively.
- Many metros with the highest concentrations of long-tenured-resident ZIP codes have registered slow population growth or even population declines over the past three-and-a-half decades.
- Pittsburgh, one of only seven large metros that has lost population since 1980, has several of the “oldest” ZIP codes in the country. Far from downtown, near the West Bend area, the median move-in year for residents of ZIP code 15433 was 1984. What’s more, a whopping 41.4% have been there since 1979 or before.
- The longest-tenured neighborhoods in Las Vegas, the metro with the shortest resident tenure in our sample, are far from The Strip. In both Moapa Valley and Amber, the median move-in year is 2003. It isn’t quite right to characterize the residents of these neighborhoods as having seen it all because only 4.4% of them have been in the same home since 1979 or before.
- The ZIP code 87052, largely populated by people living in the Kewa Pueblo outside Albuquerque, N.M., has a median move-in date of 1986, a notable exception in a list dominated by Eastern areas. Some 40.4% of the people there have lived in their current residence since 1980 or earlier.
- Co-op City (10475) in New York – This sprawling apartment complex in the Bronx has a lot of residents who have stayed put. Despite being majority renters, with a 41.2% homeownership rate, the median household moved into its current unit in 2000. Altogether, 14.1% of residents have been there since 1979 or before. And, in another reversal of trend, the median renter has lived there longer than the median owner by a year.
Click here to download the full data set.
What are some key lessons here?
Generally speaking, people who live in metros in the Midwest, East and Northeast have stayed put longer than those in metros in the Southeast, Southwest and West. This reflects how the nation’s population has shifted west over the past three-and-a-half-decades. And this population shift drives the tenure patterns: Those who stay put push up the median length of residency, while those moving elsewhere drive down median tenure in their adopted communities. All but one of the metros with the highest proportion of householders who have lived in their current residence since 1979 or before are in the Midwest and Northeast. Honolulu is the only Western metro to make the top 10, while Pittsburgh leads the way, with 16.9% of people in the metro area living in homes they moved into in 1979 or earlier. Rounding out the bottom of the list are Las Vegas, where only 1.5% of the population has lived in the same home since 1979 or earlier, Cape Coral, Fla., West Palm Beach, Fla., and Phoenix.
Methodology:
We analyzed and mapped ZIP code-level data from the American Community Survey’s 2016 five-year sample. Variables included are B25038 & B25039, which respectively provide counts of residents who have lived in the same home over various time periods and the median year householders moved in.
Census population data from 1980 and 2016 was used to determine population change at the metro level.
We classified ZIP codes as either “Urban”, “Suburban”, or “Rural” by using a combination of the percent of dwelling structures that are multifamily units, and density of housing units per square mile all based on the 2010 census numbers according to the following classifications:
when proportion multifamily > .75 and density > 600 then ‘Urban’
when proportion multifamily > .75 and density > 100 and density <= 600 then ‘Suburban’
when proportion multifamily > .75 and density > 0 and density <= 100 then ‘Rural’
when proportion multifamily > .5 and proportion multifamily <= .75 and density > 750 then ‘Urban’
when proportion multifamily > .5 and proportion multifamily <= .75 and density > 100 and density <= 750 then ‘Suburban’
when proportion multifamily > .5 and proportion multifamily <= .75 and density <= 100 then ‘Rural’
when proportion multifamily > .1 and proportion multifamily <= .5 and density > 1000 then ‘Urban’
when proportion multifamily > .1 and proportion multifamily <= .5 and density > 100 and density <= 1000 then ‘Suburban’
when proportion multifamily > .1 and proportion multifamily <= .5 and density <= 100 then ‘Rural’
when proportion multifamily >= .0 and proportion multifamily <= .1 and density >= 150 then ‘Suburban’
when proportion multifamily >= .0 and proportion multifamily <= .1 and density < 150 then ‘Rural’

