What are you in the mood for?
We’ve set out to find the most diverse dining destinations in America. These are the places where you can find gyros, smoked brisket, po’boys, General Tso chicken and more – all without leaving the neighborhood.
To find our foodie meccas, we looked beyond the sheer number of restaurants and types when creating our foodie index. We downgraded cities where cuisine was represented disproportionately – say a city with mostly burger joints – in favor of places with a more balanced selection of restaurants. Additionally, it’s not enough to have a wide variety of food. A culinary hotspot needs to have people wanting to eat out. So, we considered how often people eat out as compared to eating in by comparing dollars spent at restaurants versus groceries.
Finally, we took into account geography. We sought out restaurant diversity at the zip code level, to measure whether eating global meant a walk or short drive versus a day trip across town.

Golden State, Global Gastronomy
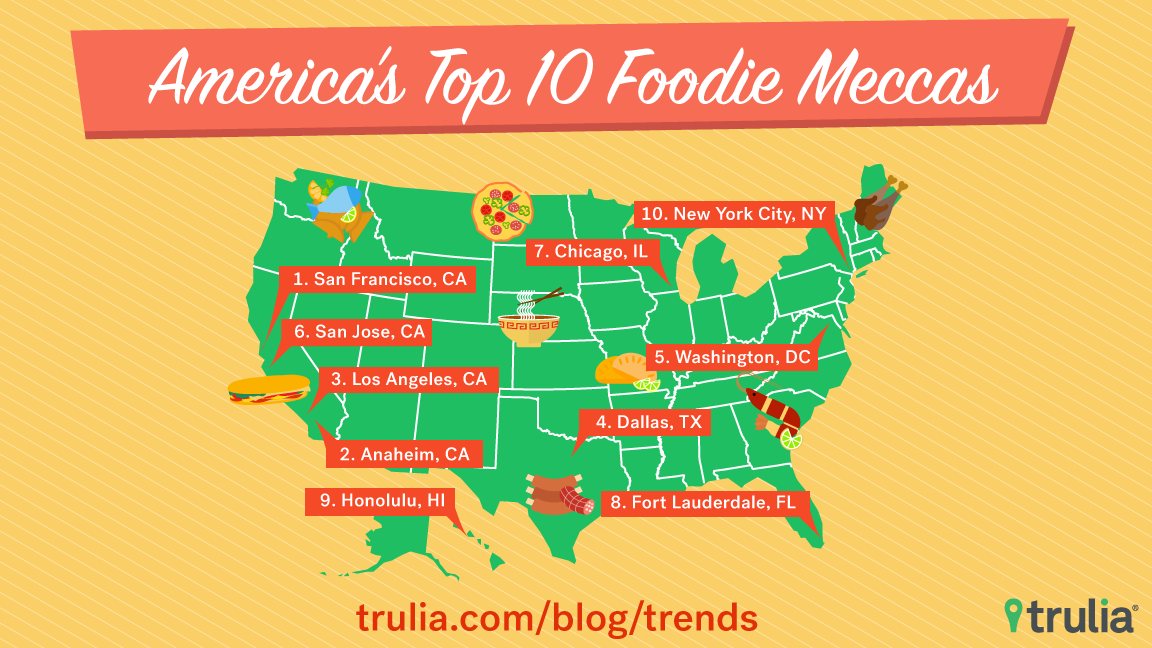
California is overwhelmingly the best place to live if you have an appetite for a full range of food; San Francisco, Los Angeles, and Anaheim dominate the three top spots of our index, with San Jose following close behind in 6th place. While housing prices are a bit more expensive in these area, the sheer diversity and proximity to food can be a temptation too irresistible to avoid if you’re a food lover.
San Francisco’s spot at the top of this list comes as no surprise to anybody who has spent time there. Some obvious factors: the San Francisco Bay is one of the nation’s busiest ports and its population among the most diverse. And, like other cities which rank high on our list, San Francisco’s density brings its varied people and cuisines in close proximity to one another.
Elsewhere across America:
- The best place to start is probably Providence, R.I., which has the most breakfast and brunch restaurants per household.
- San Francisco ranked first in 14 cuisines for most restaurants per occupied household.
- Philadelphia takes pride in its namesake the Philly cheesesteak and, not surprisingly ranks No. 1. What is surprising is the competition: Raleigh, N.C., and Montgomery, Ala., rank Nos. 2 and 3 for the famous sandwich.
- Its bounty of Asian-infused eateries helped Honolulu to the top spot for barbeque, beating out Southern-style leaders San Antonio and Austin, Texas.
- Keep your ketchup away from the hot dog capital; hot dog aficionados in Chicago, which has the most hot dog joints per household, firmly believe ketchup has no place on this traditional American bite.
- Minneapolis comes out on top for African restaurants; a little more than 21% of its foreign born population are African, which is the second highest ratio among the 100 biggest metros.
- Don’t ask us why: Madison, Wis., has the most fish ‘n’ chip restaurants per household.
- What would be the odds? Las Vegas has the most steakhouses and buffets.
- And if you’d like to avoid meat, San Jose, Calif., has the most vegetarian restaurants per household, and Honolulu has the most vegan restaurants per household.

| Rank | Metro | Restaurants per Square Mile | Score for overall diversity and proximity of cuisines (lower is better)* | Cuisines per Metro | Dollars Spent Out vs. at Dollars Spent at Groceries | Final Index (out of 100 possible) |
| 1 | San Francisco-Redwood City-South San Francisco, CA | 9.24 | 1.81 | 92 | $1.54 | 92.6 |
| 2 | Anaheim-Santa Ana-Irvine, CA | 8.27 | 2.25 | 85 | $1.06 | 82.3 |
| 3 | Los Angeles-Long Beach-Glendale, CA | 5.12 | 2.69 | 93 | $1.03 | 81.6 |
| 4 | Dallas-Plano-Irving, TX | 1.51 | 2.20 | 83 | $1.14 | 77.6 |
| 5 | Washington-Arlington-Alexandria, DC-VA-MD-WV | 1.55 | 2.24 | 86 | $1.16 | 76.4 |
| 6 | San Jose-Sunnyvale-Santa Clara, CA | 1.40 | 2.17 | 82 | $1.10 | 75.8 |
| 7 | Chicago-Naperville-Arlington Heights, IL | 3.67 | 2.65 | 92 | $1.00 | 72.4 |
| 8 | Fort Lauderdale-Pompano Beach-Deerfield Beach, FL | 2.74 | 1.35 | 74 | $0.86 | 72.3 |
| 9 | Urban Honolulu, HI | 3.79 | 1.54 | 57 | $1.50 | 71.9 |
| 10 | New York-Jersey City-White Plains, NY-NJ | 8.04 | 3.18 | 98 | $1.00 | 71.4 |
| 11 | Atlanta-Sandy Springs-Roswell, GA | 1.12 | 2.02 | 86 | $0.91 | 70.6 |
| 12 | Boston, MA | 3.12 | 3.03 | 83 | $0.96 | 68.5 |
| 13 | Charlotte-Concord-Gastonia, NC-SC | 0.69 | 1.69 | 68 | $1.02 | 66.9 |
| 14 | Jacksonville, FL | 0.76 | 1.80 | 71 | $1.02 | 66.9 |
| 15 | Orlando-Kissimmee-Sanford, FL | 1.10 | 3.02 | 79 | $1.24 | 66.5 |
| 16 | Oakland-Hayward-Berkeley, CA | 3.47 | 2.15 | 84 | $0.78 | 66.3 |
| 17 | Seattle-Bellevue-Everett, WA | 1.35 | 2.07 | 87 | $0.86 | 65.5 |
| 18 | Miami-Miami Beach-Kendall, FL | 2.41 | 2.84 | 74 | $0.90 | 64.0 |
| 19 | Raleigh, NC | 0.87 | 1.44 | 64 | $0.98 | 62.0 |
| 20 | Houston-The Woodlands-Sugar Land, TX | 1.24 | 2.41 | 83 | $0.88 | 61.9 |
* a combination of two measures we used to produce the index.
While not a metric used to rank our cities, we also took a look at cuisines per household. Again, San Francisco ranked first, having the most restaurants per household in 14 different cuisines.
In the heartland, Chicago and Dallas rank high compared to the coasts. Dallas finds itself consistently near the top in multiple food categories. One reason: the suburb of Plano. Plano’s Asian population, ranging from Middle Eastern, to Indian, and with a large Chinese community to top it off, is three-times the overall Dallas metro average.
Notably, New York only barely makes the top 10, due to the great size of the metro’s land area and population. If you’re just visiting for the core of the Big Apple, you should find there’s plenty of food, with New York leading in the number of types of restaurants with 98 cuisines, and coming in 4th for number for restaurants per square mile at 8 restaurants per square mile.
Food Deserts
On the other end of the culinary spectrum, the Golden State once again finds itself on top or, in this case, the bottom. Both Fresno and Bakersfield are among the nation’s homogeneous food deserts. Fresno residents rarely want to eat out, spending 63.1 cents eating out for every dollar spent on groceries. Fresno also has a remarkably low count of restaurants per square mile, 0.25 per square mile, and restaurant types, with only 55 cuisines. Bakersfield bottoms out with the least restaurants per square mile at .15 restaurants per square mile, and 5th worst for restaurant types, with only 46 different cuisines.
Following inland California in its lack of food diversity, the Northeast comes up with five of the bottom 10 metros. Whether it’s New York stealing all of the chefs, or people moving out West, upstate New York, parts of Massachusetts, and Pennsylvania have a dearth of variety, and little interest in eating out. Allentown, Pa., residents have the least interest of any metro in wanting to eat out, spending half as much eating (54.5 cents on the dollar) out as they do buying groceries to eat at home, with Syracuse, N.Y., and Worcester, Mass., close behind at 67.3 cents per dollar and 63 cents per dollar, respectively.
Methodology
We used five metrics to determine our culinary diversity ranking. Yelp data on restaurant type by tag was gathered at the zip code level and aggregated up to the MSA level. From there, we calculated the total number of types of restaurants in a metro and the number of restaurants per 10,000 occupied households. In addition, we used 2 different skewness calculations, which we combined to create the score for overall diversity and proximity of cuisines, a measure we call “skew.” Skew measures the balance of a distribution; a metro with many burger places but only 1-2 or other cuisine types will have a high skew compared to a metro with five restaurants of each cuisine. One of these was the skewness of restaurant types in a metro, the distribution of restaurants by type. The other was the skewness of the total count of restaurants by zip code within a metro area. While both of the skewness calculations tell compelling stories, due the the amount of overlap we weighted each of them half as strongly, effectively making the combined skewness rankings equivalent to any other single metric. Lastly, we ranked the cities based on the rate that people eat out in comparison to shopping at groceries, calculated as dollars spent eating out vs dollars spent on groceries, using data from Moody’s Analytics Estimates of Retail Sales. Grocery sales were derived from Expenditures at Food and Beverage Stores, and restaurant sales came from Expenditures at Food Services and Drinking Places. We ranked each of these five metrics from 1 to 100, and combined them using a weighted average (12.5% weight for the two skews, 25% weight for restaurant types, dining out tendencies, and restaurants per square mile, to come up with our final index, which ranges from 1 to 100. The metro area definitions follow metropolitan divisions where available, then metropolitan statistical areas.


