
- Though sellers still largely have the upper hand, the U.S. housing market is gradually shifting in favor of buyers. The shift has progressed furthest in housing markets where affordability has eroded the most in recent years, in particular along the West Coast.
- This national shift from a sellers’ market toward a buyers’ market is also playing out locally in the most expensive neighborhoods within a metro area. On average, in ZIP codes where home values are highest, more homes are being sold further below their asking prices and selling more slowly than they would otherwise.
Home buyers are finally getting a bit of relief, at the expense of home sellers (and buyers are often sellers, too), and most noticeably in already-pricey areas where housing costs are still growing, and affordability has eroded the most.
The years-long trend of declining days on market has come to a stop, price cuts are increasingly common, and homes are more likely than in prior years to sell below their original list price. This national trend is also playing out locally, with the most expensive neighborhoods (ZIP codes, in this analysis) shifting most in favor of buyers.
Even so, affording a home and negotiating the most favorable deal may still prove challenging for many buyers – because despite these shifting conditions, most metro areas remain tilted heavily in sellers’ favor.
U.S. market shifting in favor of buyers, but most sellers still have the upper hand
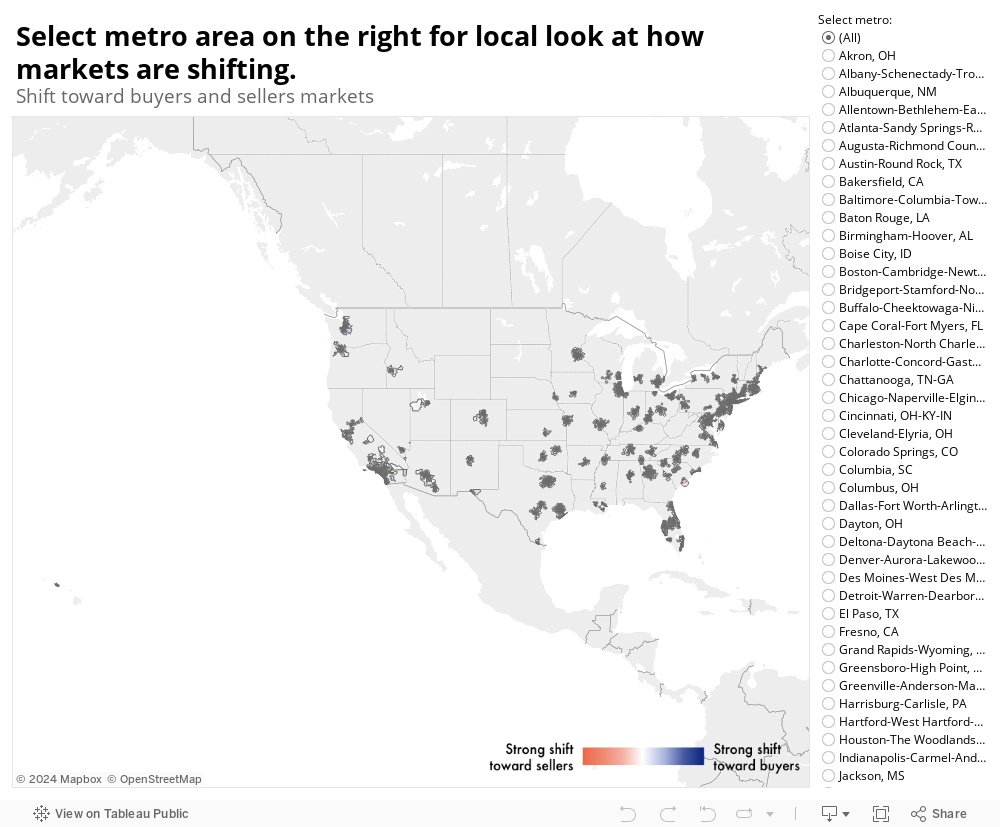
Among the 100 largest U.S. metros, conditions in 50 are now shifting in favor of buyers, a ten-fold increase from just five metros a year ago. We determined this shift by examining an average of three buyer/seller balance-of-power indicators and analyzing how they’ve changed in the last year (from January 2018 to January 2019): the share of listings with at least one price cut, the monthly median days on market, and the sales-to-list price ratio (how a home’s final selling price compares to its list price). All three have shifted in favor of buyers.
This shift also shows up in other common housing metrics. Homes sitting on the market longer, for example, can also help push up monthly measures of inventory because home shoppers can count on listings remaining active for longer, giving them more options at any given time.
The shift in favor of buyers is also happening where home values have risen the most over the past six years, suggesting that these markets may have hit an affordability ceiling.
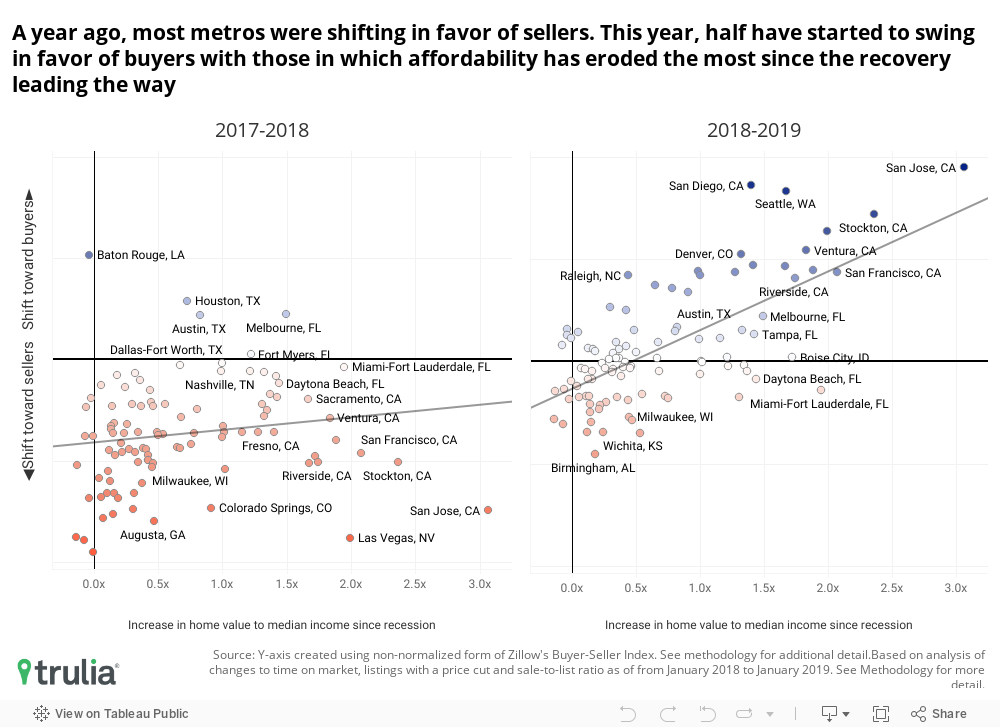
Still, because the shift being measured is only the market’s movement toward buyers or sellers, (instead of its current position) it’s important to note that most metro areas remain tilted heavily in sellers’ favor. And it may still take years before trends shift sufficiently enough for a market to actually be considered a true buyers’ market. San Francisco, for example, has experienced one of the larger recent shifts in favor of buyers among big markets – but still has the shortest days on market, the fourth-fewest price reductions, and the fifth-highest sale to list price ratio. And even if those conditions were to shift more meaningfully, San Francisco’s lofty home values alone would make it a difficult market for most typical buyers.
West Coast hits affordability ceiling, leading housing market’s shift
This shift toward buyers is most pronounced along the West Coast, where home values have both long been high and have risen by about 50 percent over the past six years. Among the 100 largest metro areas, Las Vegas shifted the most away from sellers and toward buyers over the past year, from the third-worst market for buyers a year ago (98/100) to the fifth-best (5/100) today, a 93-spot swing. Sin City’s dramatic shift was followed by San Jose (up 92 places in ranking – nearby San Francisco is up 55 places) and Seattle (up 74 places in ranking). Los Angeles made the 15th largest shift, up 46 places to the tenth-best market for buyers as of January. In these markets, home values rose between 57% and 104% from 2013 to 2019, or 7.9% to 12.6% annually. But in the last year, annual home value appreciation slowed, rising just 3% to 7%. Of course, a slowdown does not mean home prices are falling, and in these early stages of the market’s shift toward buyers, prices are still rising — just somewhat more slowly than in recent years.
Beyond the pricey West Coast, markets including Denver and Dallas – both often destinations for those moving away from the West Coast – have also shifted in favor of buyers over the past year, though less dramatically.
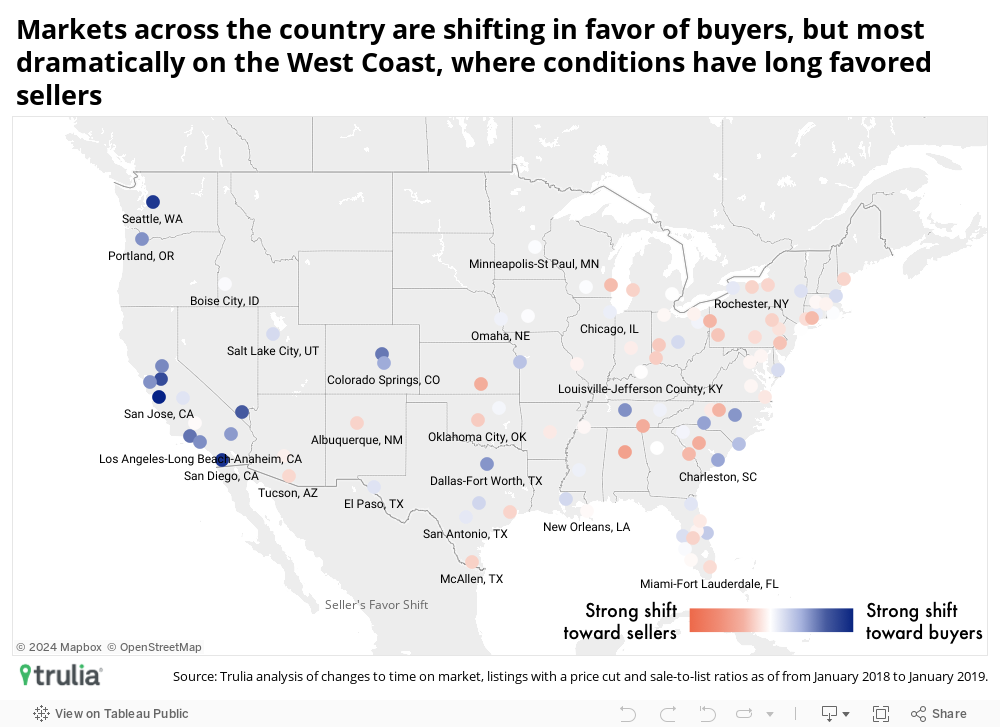
The fact that the market shift has largely progressed the most in expensive and (until recently) quickly appreciating West Coast markets suggests that housing in these areas may have hit an affordability ceiling. Prices have seemingly exceeded what most buyers are able or willing to pay, and with fewer willing and/or able buyers competing for homes, it’s harder for sellers to obtain their initial asking prices. This leads to longer days on market, more frequent price cuts, and homes selling further below asking.
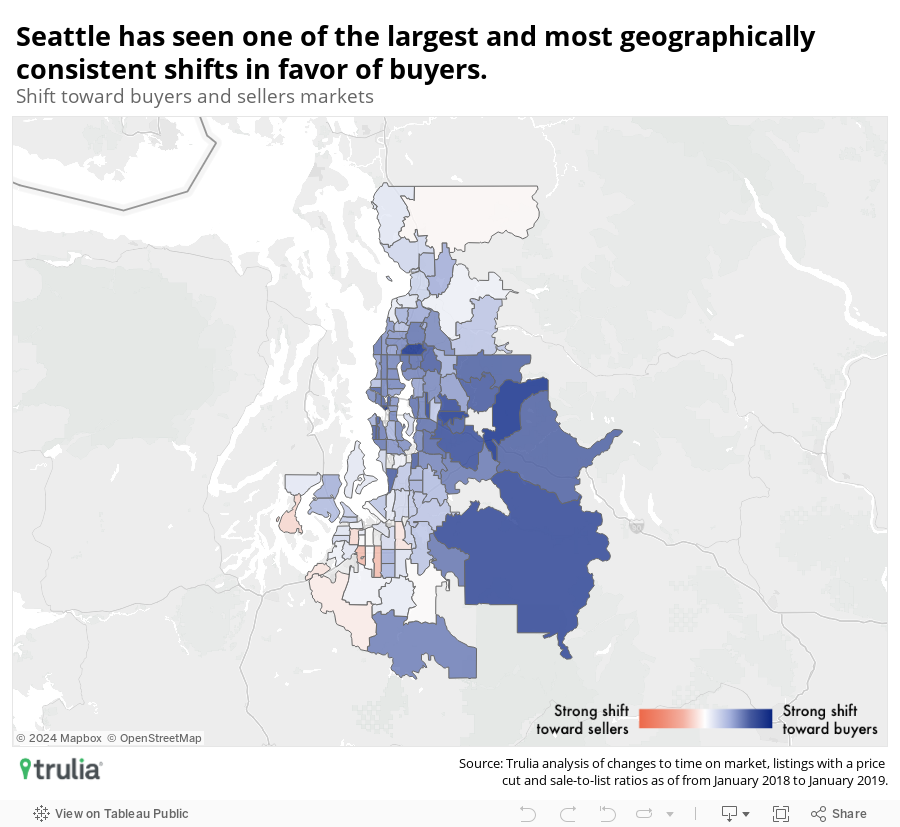
Take metro Seattle, for example: The median home value in the area is $491,500 — up 81.4% from 2013. But over the past year, Seattle has shown a clear shift toward buyers, with 91.9% of all Seattle-area ZIP codes shifting in buyers’ favor. This is a striking reversal from last year, when 98.4% of the metro’s ZIP codes shifted in favor of sellers over the year prior.
Note: Click here for ZIP-code level map of 100 largest metro areas.
Seattle’s progression towards a buyers’ market shows up in each of the balance-of-power indicators. The median number of days a listing spent on the market before selling jumped from 55 days in January 2018 to 70 days in January 2019, up 27.2%. The share of listings with price cuts more than doubled over the same period, from 6.2% to 13.9% of all for-sale listings. And while homes typically sold at their asking price a year ago, they are now selling at 3.1% below the original list price.
These changes are good news for would-be buyers – especially first-time buyers that aren’t also trying to sell a home in a softening market. But some perspective is in order. Seattle Sellers have seen home values increase by a still-substantial 4.3% over the last year, and 81.4% over the past six (10.4% annually, on average). And these gains have translated into significant declines in affordability. Six years ago, a middle-class household in Seattle earning the median annual income would need to save four years’ worth of their entire paychecks to be able to reasonably afford to buy the median-priced Seattle home. Today, they would need to save almost six years’ worth of paychecks.
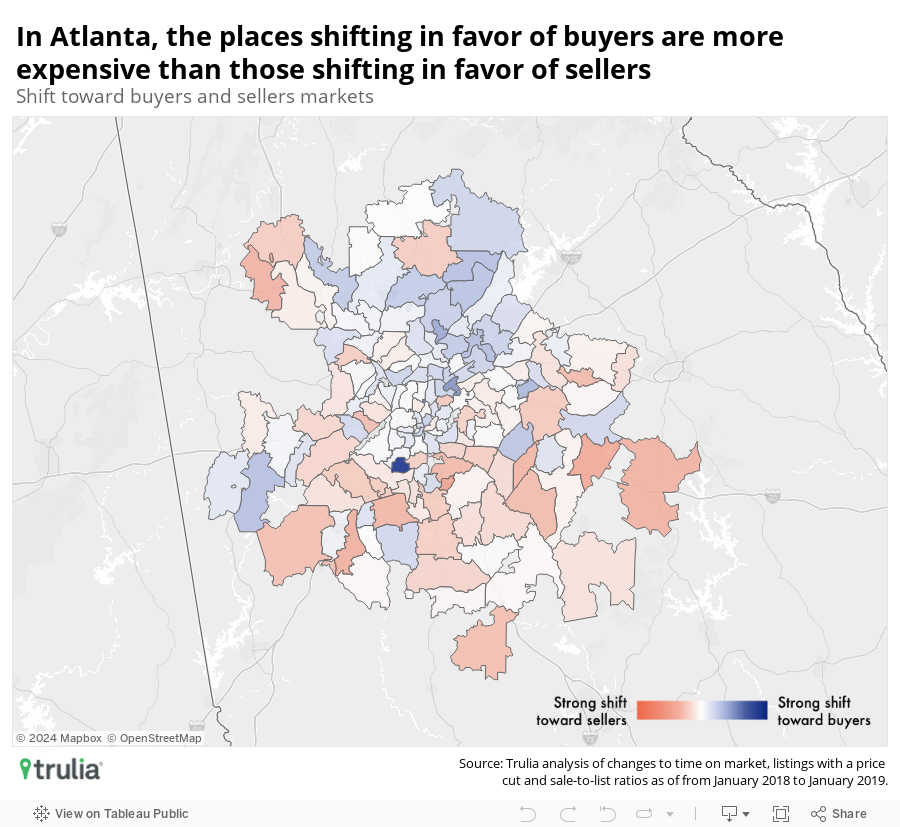
Expensive neighborhoods are cooling even in some inexpensive markets
Across markets nationwide, the neighborhoods (ZIP code areas) shifting the most towards a buyers’ market are, on average, the more expensive ones. Among ZIP codes in the 100 largest metros, the year-over-year change in median days on market 3.14 percent. However, a ZIP code with home values 10 percent higher than other ZIP codes in the same metro correspond, on average, to a change in median days on market that was 0.56 percentage points higher—almost an 18 percent lift over the change. Similarly, sales to list price ratios were down 0.43 percentage points on average year-over-year. But, a 10 percent increase in a ZIP code’s home values compared to others in the metro corresponded to an additional decrease of 0.07 percentage points on average—a decline 16.6 percent greater than the change.
Note: Click here for ZIP-code level map of 100 largest metro areas.
Looking at the metro-wide averages in Atlanta, only one of the buyer-seller balance-of-power indicators has changed much over the last year: the prevalence of price cuts has increased by 50 percent. But at the ZIP code level, there’s a striking difference over the past year in the number of days it takes to sell a property between ZIP codes shifting in favor of buyers and those shifting in favor of sellers, an indicator that showed little change at the metro level. Among ZIP codes shifting in favor of buyers, with a median home value of $299,400, days on market increased 12.1 percent. In ZIP codes moving in favor of sellers, days on market decreased by roughly the same amount (12.7 percent) and the median home value was $227,800.
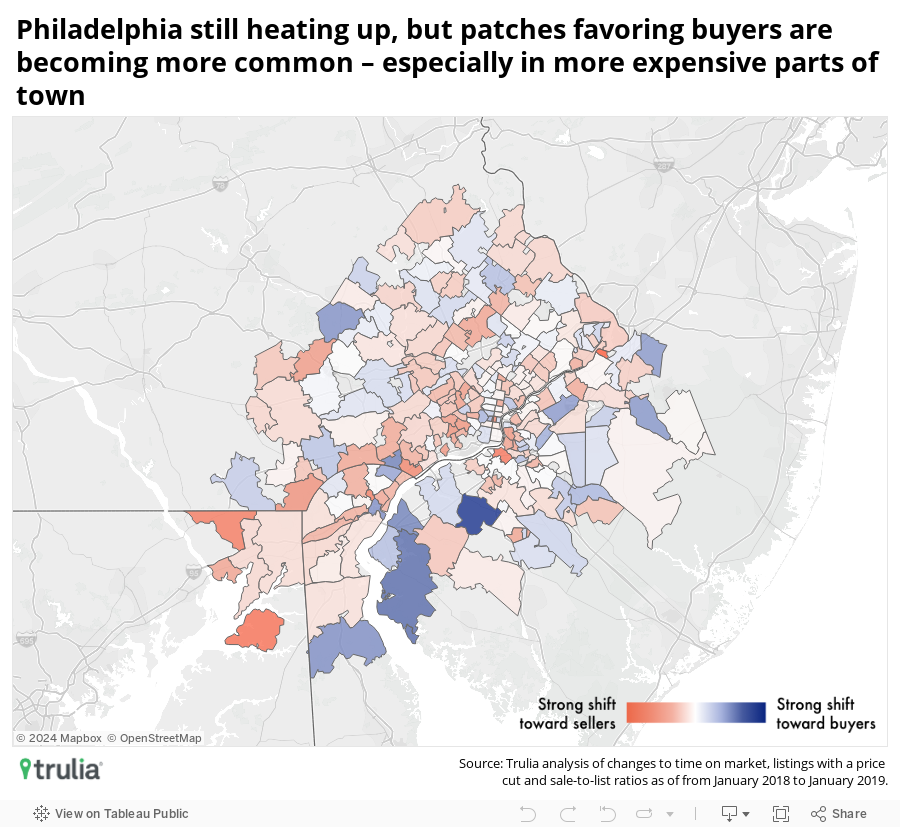
Meanwhile, some metro areas – in general, those where home values have increased more modestly over the last six years and homes are well within reach of the middle class – are still shifting towards sellers, including Philadelphia, Oklahoma City and Dayton.
Note: Click here for ZIP-code level map of 100 largest metro areas.
Generally, in Philadelphia, where home values have appreciated by a more modest 24.2% over the past 6 years, sellers can expect to sell their homes five days faster than a year ago (88 days in January 2019, down from a median of 93 a year ago). But other buyer-seller indicators have not changed significantly over the last year. Additionally, as of January 2019 34.5% of all ZIP codes in Philadelphia were shifting in favor of buyers, up from 30.3% a year ago, suggesting a bit of momentum in buyers’ favor, despite the fact that the metro as a whole is still moving in favor of sellers. And similar to the trend in Atlanta, this shift in favor of buyers is happening in Philadelphia’s most expensive ZIP codes.
So Who’s Calling the Shots?
The market shift toward buyers after a multi-year stretch favoring sellers, especially in more expensive metros and neighborhoods, is welcome news for many buyers. Shifts in the three indicators discussed here often go hand-in-hand with other important indicators, notably inventory. Inventory is finally growing again in some of the tightest coastal markets, as buyers stop snapping up listings virtually as soon as they are advertised and some listings linger on the market.
Because there are no clear rules or authority for officially calling a buyers’ or sellers’ market, both buyers and sellers should pay close attention to market cues. Even if a broader metro area doesn’t appear to be shifting in anyone’s favor, changes can be very different from neighborhood-to-neighborhood. Having an idea of these trends can greatly help inform the degree to which buyers and sellers have leverage in a given deal.
Methodology
We quantified the degree to which areas are shifting towards buyers or sellers using three input metrics:
- Percentage of listings with a price cut: The percentage of current for-sale listings with a price cut during the month.
- Median days on market, list-to-sale: The median days on market of homes sold within a given month, including foreclosure re-sales.
- Median sale-to-list price ratio: The median of the ratio between the sale price and the list price for all homes (e.g. if a home with a list price of $200k sells for $250k, its ratio would be 5:4, or 1.25)
The days on market and sale-to-list ratio used in the calculation are three-month rolling averages. Further detail can be found here.
Median home values are based on the Zillow Home Value Index.
Affordability is measured using the Price-to-Income Ratio published on Zillow’s data page.
To get a better sense of how the three market components that we used to are playing out in relation to home values, we ran several fixed effects regression models (using metro areas as the fixed effects) These regressions considered only zip codes in the 100 largest metro areas.
| Dependent variable | ||
| Sales to List Price Ratio Change YoY | Days on Market Percent Change YoY | |
| (1) | (2) | |
| Log Median Home Value Jan 2019 | -0.0071*** | 0.056*** |
| MSA clustered std. errors | (0.0017) | (0.012) |
| MSA fixed effects | Yes | Yes |
| Observations | 6,028 | 6,028 |
| Notes: *p<0.1; **p<0.05; ***p<0.01 | ||

