
Financial experts say buying an unaffordable home, where monthly mortgage payments exceed 31% of a household’s income, is usually a bad idea. And for the most part, we agree. Homes are expensive to acquire and maintain, and mortgage payments are almost always a household’s biggest single expense. Outsized mortgage payments can lead to household financial stress down the road.
But in many housing markets where most workers see strong wage and income growth – New Haven, Conn., Providence, R.I., and Newark, N.J., among them – mortgage payments actually shrink as part of the monthly budget and can become affordable within just a few years and, in some places, in just a few months.
On the flipside, we found that in some metros – San Francisco, Los Angeles and New York to name a few – home prices are so high and wage growth so sluggish that for the life of loan, chances are buyers will always be shelling out 31% or more of their income for mortgage costs.
We’ve crunched the numbers to identify where, and when, buying an unaffordable home might not be such a terrible idea. To do this, we’ve identified metros:
- Where the median home is feasibly unaffordable to millennial households (25-34 year olds), that is, where initial mortgage payments exceed 31% the federal government’s definition of unaffordable –
- And those payments don’t exceed 43% of income, the limit a vast majority of lenders place on new mortgages
- And finally, we projected lifecycle income growth of millennial households to calculate the number of years it would take for mortgage payments to drop below 31% of a household’s income.
Where Buying an Unaffordable Home Isn’t a Terrible Idea
First, the good news. Of the 100 largest housing markets in the U.S., initial mortgage payments are affordable in 73. In the most affordable of these 73 markets, initial payments constitute 20% or less of median household income. What’s more, households in the top 10 most affordable markets end up paying 7% or less of their income towards their mortgage payments by the end of the loan. For example, in Columbia, S. C., where home prices are low but income growth is strong, mortgage payments drop from 17.0% of monthly income at the beginning of the loan to 6.6% at the end.

| Markets Where First Mortgage Payments Are Already Affordable | ||||
| # | U.S. Metro | % of Initial Monthly Income Spent on Housing at Beginning of 30-year Mortgage | % of Monthly Income Spent on Housing at End of 30-Year Mortgage | Median Home Value, October 2015 (Assumed Purchase Price) |
| 1 | Detroit, MI | 14.0% | 7.6% | $60,047 |
| 2 | Birmingham, AL | 14.4% | 7.7% | $118,832 |
| 3 | Pittsburgh, PA | 16.3% | 8.5% | $122,589 |
| 4 | Akron, OH | 16.6% | 9.9% | $123,065 |
| 5 | Columbia, SC | 17.0% | 6.6% | $115,443 |
| 6 | Toledo, OH | 17.1% | 7.3% | $96,623 |
| 7 | Indianapolis, IN | 17.1% | 7.4% | $127,922 |
| 8 | Little Rock, AR | 17.1% | 7.4% | $119,256 |
| 9 | Dayton, OH | 17.2% | 7.3% | $100,381 |
| 10 | Louisville, KY | 17.7% | 8.4% | $130,099 |
| To download the full dataset for the 100 largest U.S. metros, click here. | ||||
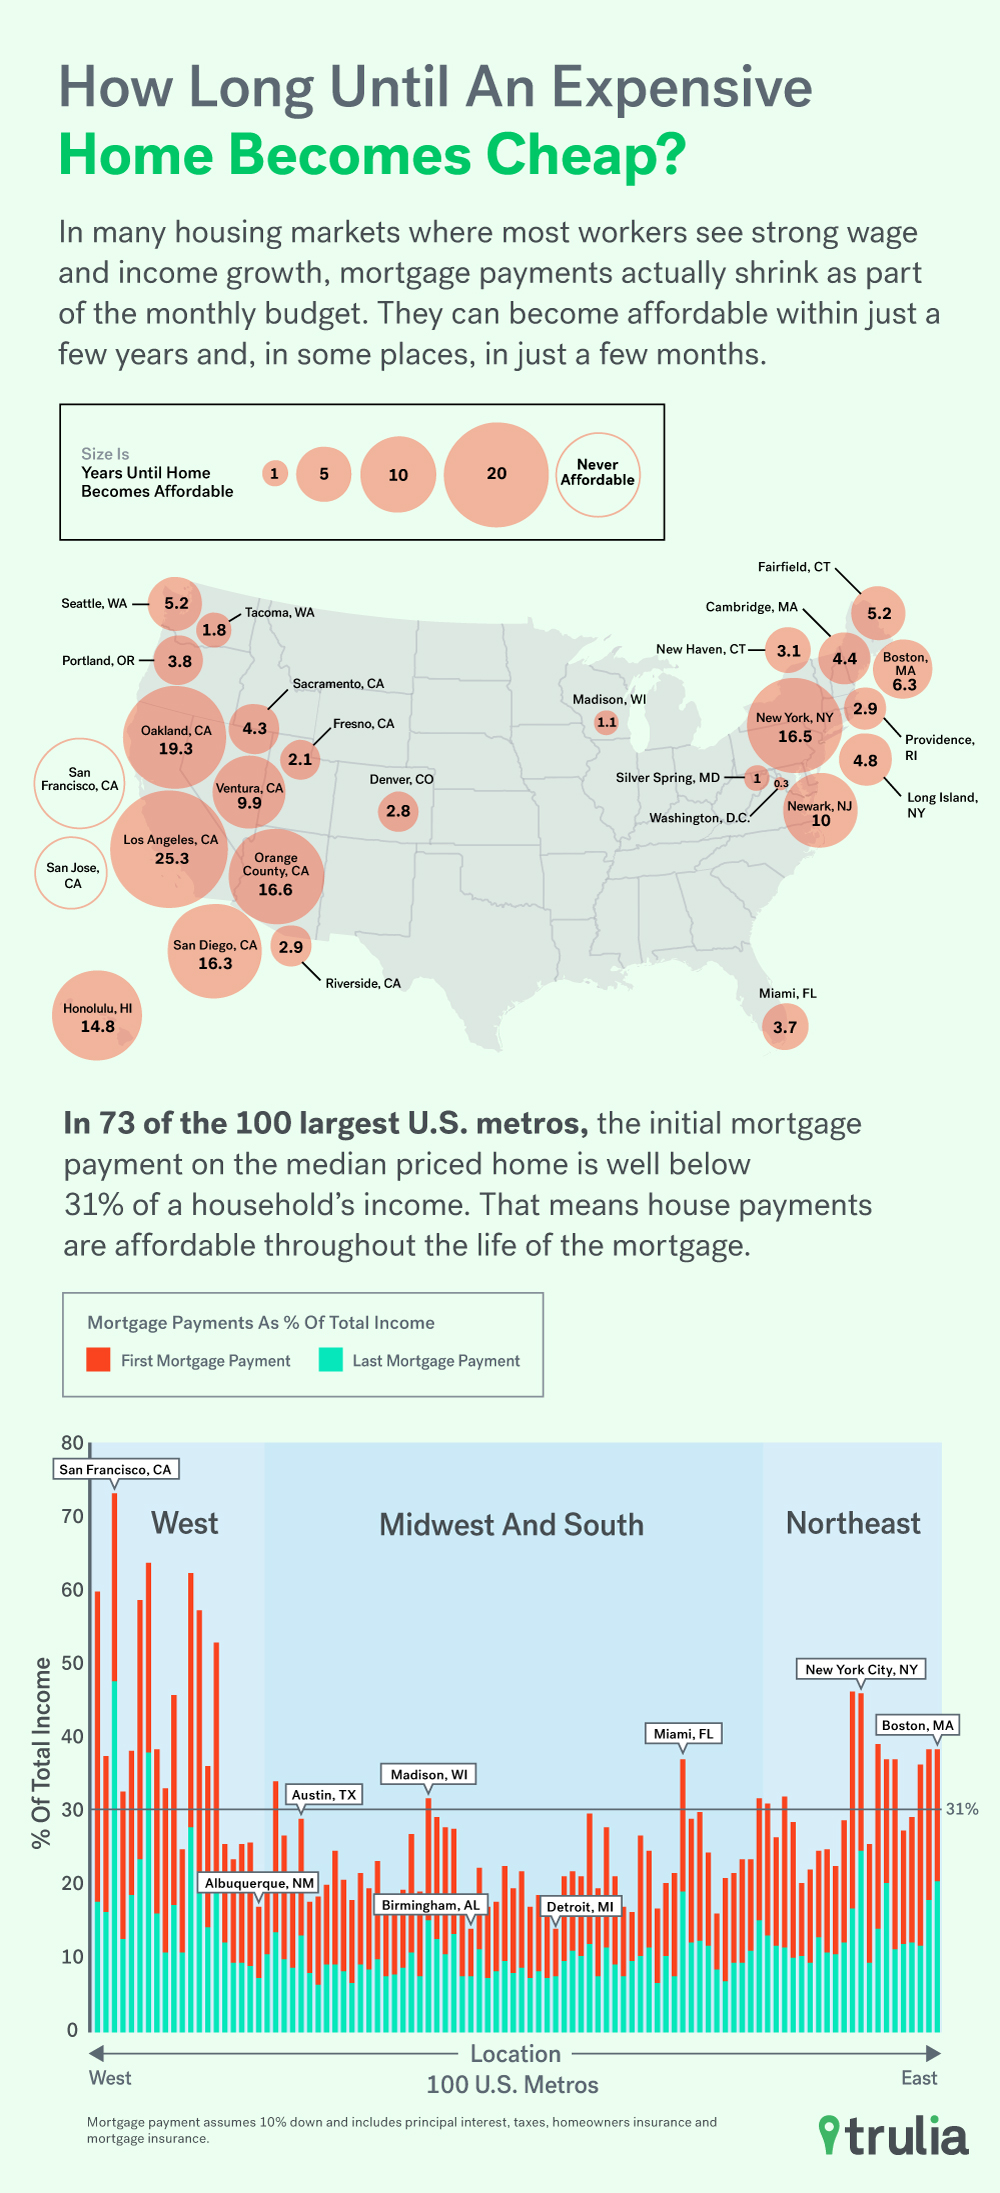
On the flipside, the median priced home is feasibly unaffordable to millennials in 17 of the largest 100 markets. Though mortgage payments are initially unaffordable in these metros, affordability comes quickly. In places like Washington, DC, Silver Spring, Md., Madison, Wis., and Tacoma, Wash., that number is less than two years. Even in some pricey East Coast metros, such as Cambridge, Mass., Fairfield, Conn., Boston and Long Island, N.Y., mortgage payments become affordable in less than six years.
| Feasibly Unaffordable Markets | |||||
| # | U.S. Metro | Years Until Mortgage Payments Become Affordable | % of Initial Monthly Income Spent on Housing at Beginning of 30-year Mortgage | % of Monthly Income Spent on Housing at End of 30-Year Mortgage | Median Home Value, October 2015 (Assumed Purchase Price) |
| 1 | Washington, DC | 0.3 | 31.2% | 13.2% | $364,345 |
| 2 | Silver Spring, MD | 1.0 | 32.0% | 11.5% | $382,921 |
| 3 | Madison, WI | 1.1 | 31.8% | 15.1% | $213,871 |
| 4 | Tacoma, WA | 1.8 | 32.7% | 12.8% | $242,994 |
| 5 | Fresno, CA | 2.1 | 33.3% | 10.9% | $197,183 |
| 6 | Denver, CO | 2.8 | 34.2% | 13.6% | $314,009 |
| 7 | Riverside–San Bernardino, CA | 2.8 | 36.1% | 14.4% | $282,539 |
| 8 | Providence, RI | 2.9 | 36.3% | 11.7% | $235,895 |
| 9 | New Haven, CT | 3.1 | 37.0% | 11.2% | $207,781 |
| 10 | Miami, FL | 3.7 | 36.9% | 19.1% | $241,800 |
| 11 | Portland, OR | 3.8 | 37.7% | 16.5% | $300,544 |
| 12 | Sacramento, CA | 4.3 | 38.6% | 16.0% | $329,568 |
| 13 | Fairfield County, CT | 4.4 | 39.4% | 13.9% | $386,009 |
| 14 | Long Island, NY | 4.8 | 37.0% | 20.2% | $402,194 |
| 15 | Cambridge, MA | 5.2 | 38.6% | 17.9% | $422,692 |
| 16 | Seattle, WA | 5.2 | 38.3% | 18.8% | $401,870 |
| 17 | Boston, MA | 6.3 | 38.6% | 20.6% | $411,122 |
| To download the full dataset for the 100 largest U.S. metros, click here. | |||||
In these metros, the number of years it takes for unaffordable payments to become affordable is primarily determined by the magnitude of initial unaffordability. Metros that are just barely unaffordable, such as Washington, DC, and Silver Spring, Md., become affordable rather fast, whereas metros that are more unaffordable, such as Boston and Seattle, take time. But if we look at the entire 30-year lifecycle of a mortgage, other metros of see quite a large reduction because of the compounding effect of long-term income growth.
Where Income Growth Has the Biggest Impact on Mortgage Payments
Millennials in the Northeast and California stand to benefit most from the largest potential drop in income spent on mortgage payments over the life of a loan. This is largely due to the fact that the projected income growth in these metros is high. New Haven, Conn., tops the list, where millennials can expect mortgage payments to drop from 37.0% of household income to 11.2% over 30 years – a 25.7 percentage point decrease. Several other East Coast metros make the list as well – millennials buying the median priced home today in Fairfield, Conn., Providence, R.I., Cambridge, Mass., and Silver Spring, Md., can expect a reduction in payments of at least 20 percentage points over the life of the mortgage.
| Where Mortgage Payments Drop Most Because of High Income Growth | |||||
| # | U.S. Metro | Percentage Point Change in % of Monthly Income Spent on Housing Over 30 Year Mortgage (Month 1 Payment Minus Month 360 Payment) | % of Initial Monthly Income Spent on Housing at Beginning of 30-year Mortgage | % of Monthly Income Spent on Housing at End of 30-Year Mortgage | Projected Annual Income Growth |
| 1 | New Haven, CT | -25.7% | 37.0% | 11.2% | 2.6% |
| 2 | Fairfield County, CT | -25.5% | 39.4% | 13.9% | 1.8% |
| 3 | Providence, RI | -24.6% | 36.3% | 11.7% | 2.2% |
| 4 | Sacramento, CA | -22.6% | 38.6% | 16.0% | 1.0% |
| 5 | Fresno, CA | -22.4% | 33.3% | 10.9% | 1.8% |
| 6 | Riverside–San Bernardino, CA | -21.7% | 36.1% | 14.4% | 1.2% |
| 7 | Portland, OR | -21.2% | 37.7% | 16.5% | 1.0% |
| 8 | Cambridge, MA | -20.7% | 38.6% | 17.9% | 0.9% |
| 9 | Denver, CO | -20.7% | 34.2% | 13.6% | 1.0% |
| 10 | Silver Spring, MD | -20.5% | 32.0% | 11.5% | 1.7% |
| To download the full dataset for the 100 largest U.S. metros, click here. | |||||
Where Buying an Unaffordable Home Isn’t Such a Great Idea
Last, there are 10 metros where millennials might not want to buy a home (and might not even qualify for a mortgage) because unaffordable payments persist for much of the loan term. To no surprise, many pricey West Coast metros top the list. For example, millennials in Ventura County, Calif., San Diego and Los Angeles would have to wait approximately 9 and half years, 16 years 3 months, and 25 years 3 months, respectively, until income growth makes mortgage payments affordable. In pricey San Francisco and San Jose, Calif., unaffordable payments would persist for the life of the loan. The only non-West Coast metro to make the list is Newark, N.J., where mortgage payments become affordable in a little over 10 years.

|
Where Buying An Unaffordable Home Never (Or After Many Years) Becomes Affordable |
|||||
| # | U.S. Metro | Years Until Mortgage Payments Become Affordable | % of Initial Monthly Income Spent on Housing at Beginning of 30-year Mortgage | % of Monthly Income Spent on Housing at End of 30-Year Mortgage | Median Home Value, October 2015 (Assumed Purchase Price) |
| 1 | San Francisco, CA | N/A | 73.3% | 47.9% | $1,127,837 |
| 2 | San Jose, CA | N/A | 63.8% | 38.2% | $925,768 |
| 3 | Los Angeles, CA | 25.3 | 62.6% | 28.0% | $514,931 |
| 4 | Oakland, CA | 19.3 | 58.7% | 23.5% | $623,538 |
| 5 | Orange County, CA | 16.6 | 57.4% | 20.9% | $635,363 |
| 6 | New York, NY | 16.5 | 46.0% | 24.9% | $430,576 |
| 7 | San Diego, CA | 16.3 | 53.1% | 22.0% | $487,343 |
| 8 | Honolulu, HI | 14.8 | 59.9% | 17.7% | $605,349 |
| 9 | Newark, NJ | 10.1 | 46.3% | 17.0% | $321,394 |
| 10 | Ventura County, CA | 9.6 | 45.7% | 17.4% | $510,181 |
| To download the full dataset for the 100 largest U.S. metros, click here. | |||||
Methodology
Buying a home is one of the biggest financial decisions a household can make. In general, buying is a better financial decision than renting, but at the same time, median housing prices in several markets are unaffordable and down payments can be hard to come by. So the decision can be tough. If households plan on staying in their home for a long period of time, buying an unaffordable home probably isn’t a terrible idea. If a household moves often, it’s almost certainly a better idea to rent.
We developed a three-step process to identify metro areas where buying an unaffordable home might not be a terrible idea, First, we classify markets as “feasible unaffordable” if the monthly mortgage payment (assuming a 10% down payment and mortgage insurance) on the median priced home falls between 31% and 43% of median monthly income for millennials (ages 25-34). We base this on a combination of the federal government’s 31% affordability threshold and qualified mortgage guidelines that cap borrowers’ debt-to-income ratio at 43%.
Second, we’ve estimated projected 30-year income growth of millennial households. To do so, we looked at the percentage difference in median household income between households aged 25-34 and households aged 55-64 in each metro using 2014 American Community Survey Data. We annualized this percentage over 30 years to get an idea of how much income growth a 25-34 year old can expect over their career, and then, assuming an inflation rate of 2%, use it project future monthly income for the median 25-34 year old household.
Last, we divided the monthly mortgage payment, including taxes and homeowners insurance, by the projected monthly income to determine the median share of income spent on housing for each month of the loan term. For each of the largest 100 metros, we then examined the number of months into the future when mortgage payments drop below 31% of monthly income.

