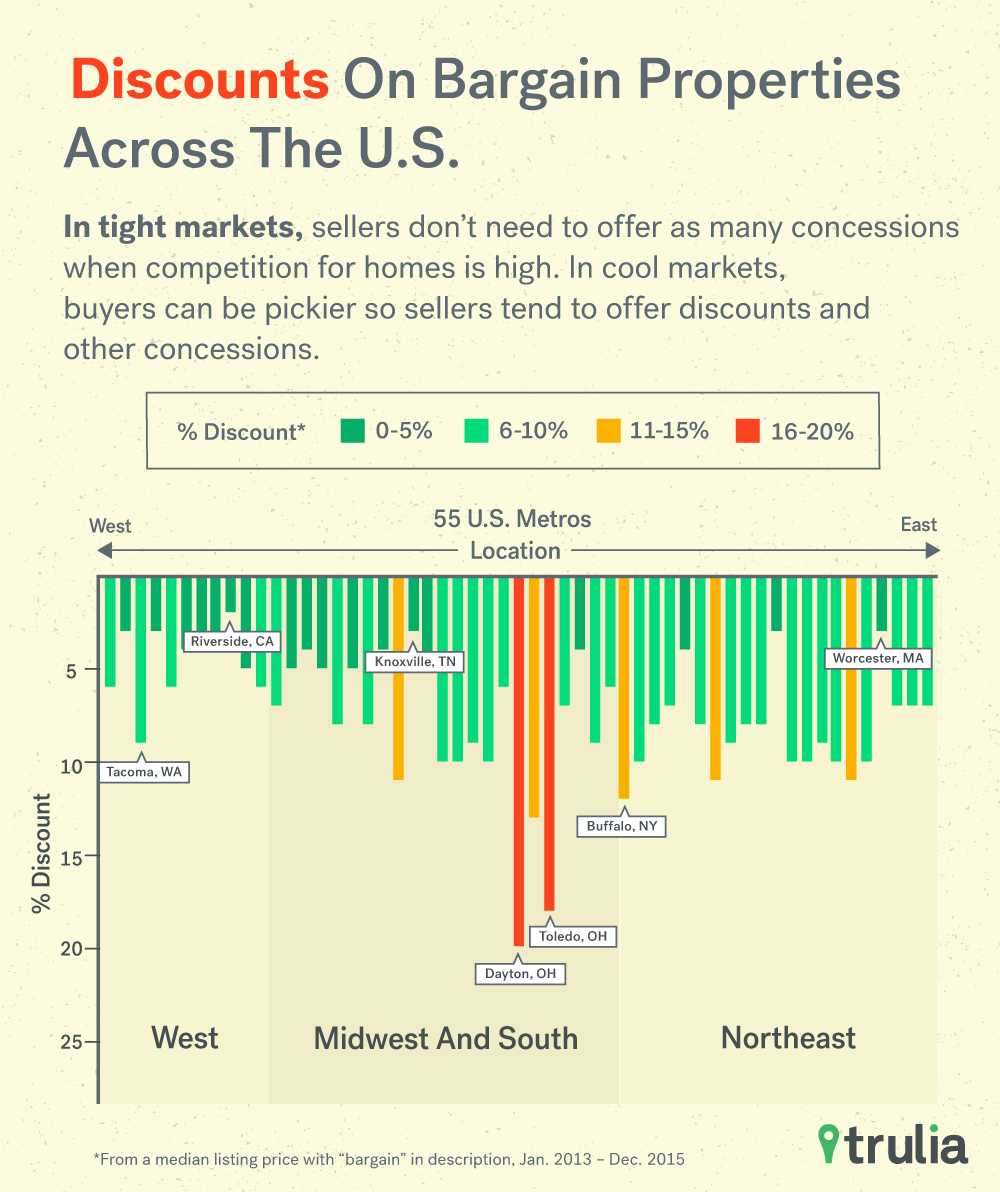
The B-word – bargain – gets thrown around a lot in the real estate world. Buyers are looking for one, and sellers often use the term to market their home. But talk is cheap, so we’ve combed through all the homes for sale on Trulia in the 100 largest housing markets to find out where properties listed with the word bargain, or similar words, are actually priced at a discount. To no surprise, we found that not all properties listed as bargains are actually a good deal.
In fact,
- Homes listed for sale with the term “bargain” (or similar) in their description are offered for a lower price compared to other listings without such terms, in only 55 of the largest 100 U.S. housing markets;
- Markets with the largest discount on bargain properties are in the Bargain Belt, where markdowns range from 10-20%;
- Markets with the smallest discount on bargain properties are mostly along the Costly Coasts, where price cuts range from just 2-4%.
Bargain Discount Highest in Bargain Belt, Lowest on Costly Coasts
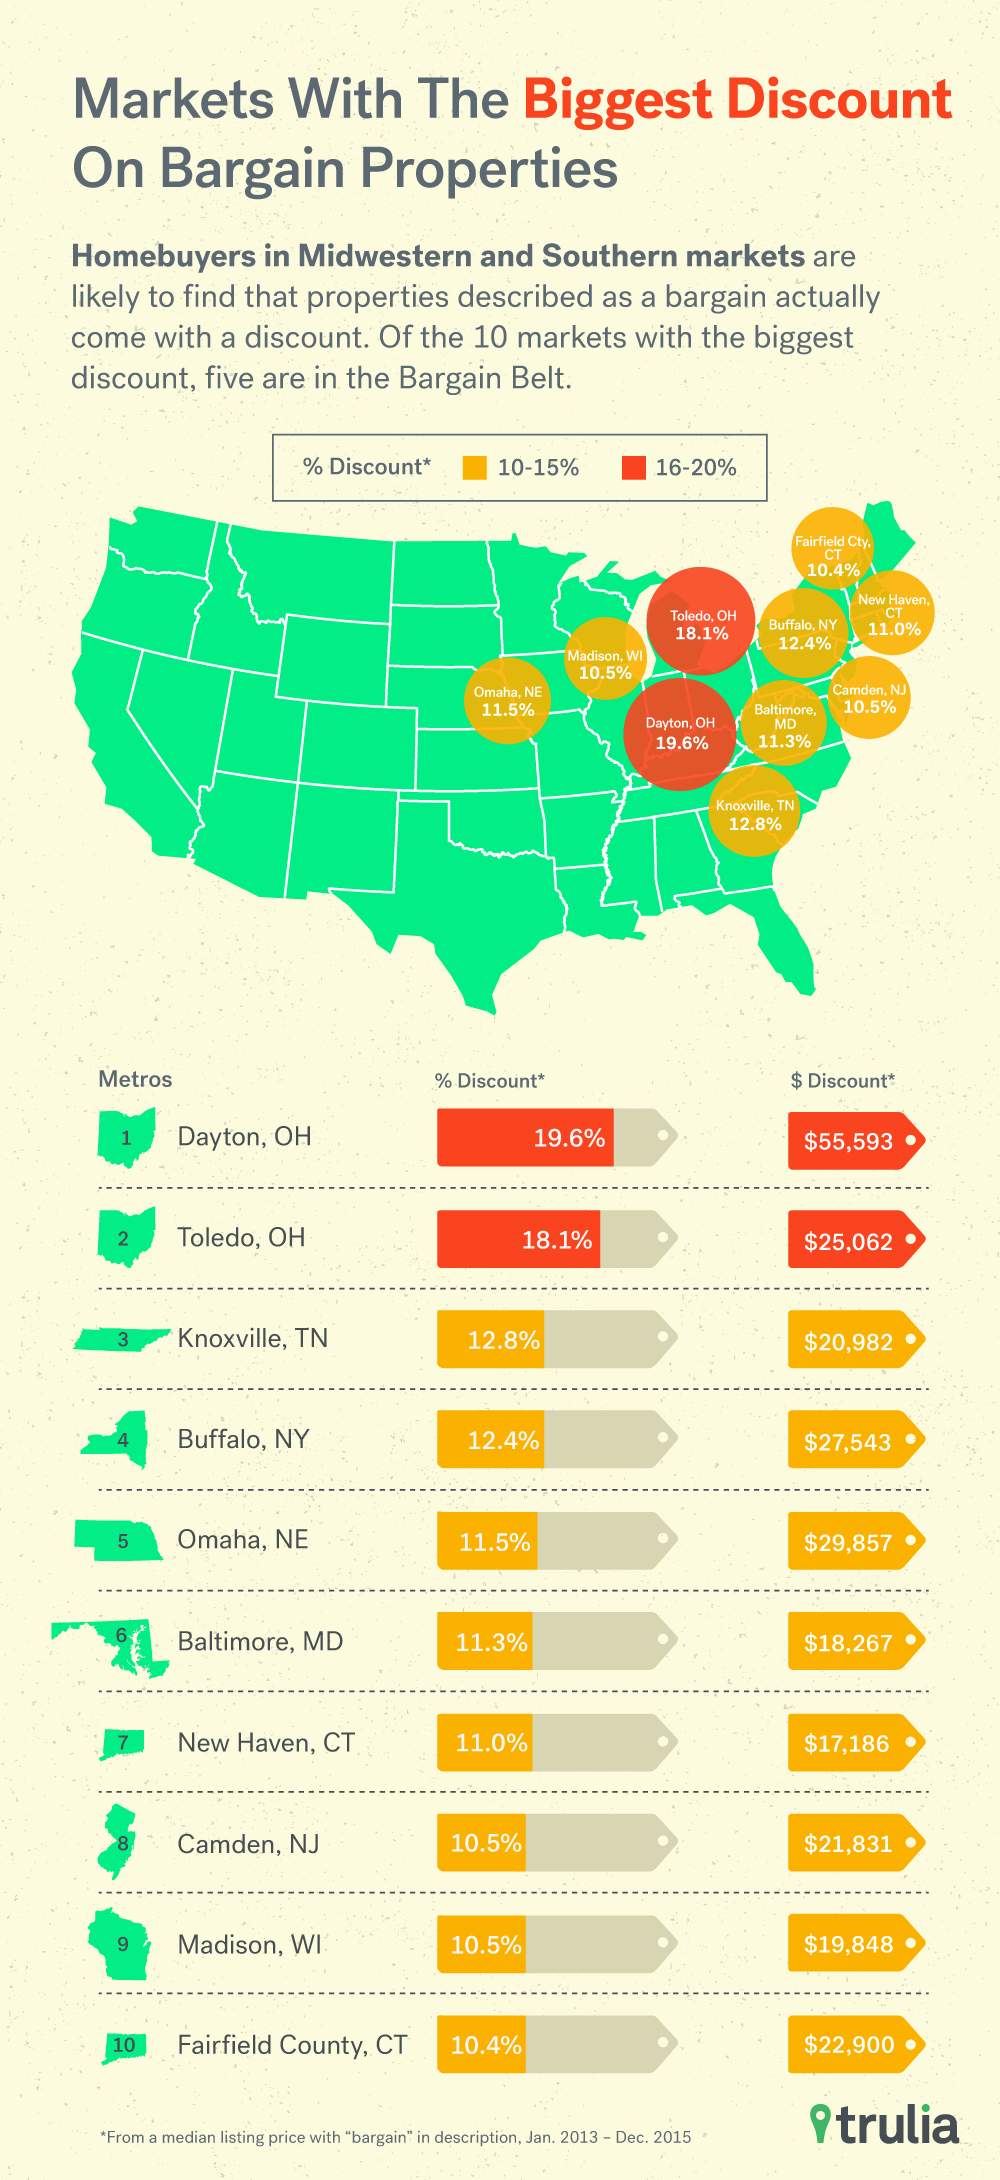
Homebuyers in Midwestern and Southern markets – a region we collectively call the Bargain Belt – are more likely to find that properties described as a bargain actually come with a discount. Of the top 10 housing markets with the largest discount, five are in the Bargain Belt. Dayton and Toledo, Ohio, lead the pack, where, on average, bargain properties come with a 19.6% and 18.1% markdown, respectively. On the median priced home, this translates to a $22,900 price cut in Dayton and $19,848 cut in Toledo. Knoxville, Tenn., Buffalo, and Omaha, Neb., round out the top five, where price reductions range from 11.5%-12.8%.

| Top 10 Housing Markets with Largest Discount on Bargain Properties | ||||
| # | U.S. Metro | Discount % | Median Listing Price, Jan. 2013 – Dec. 2015 | Example Discount on Median Listing Price |
| 1 | Dayton, OH | 19.6% | $116,900 | $22,900 |
| 2 | Toledo, OH | 18.1% | $109,900 | $19,848 |
| 3 | Knoxville, TN | 12.8% | $169,900 | $21,831 |
| 4 | Buffalo, NY | 12.4% | $138,888 | $17,186 |
| 5 | Omaha, NE | 11.5% | $159,000 | $18,267 |
| 6 | Baltimore, MD | 11.3% | $265,000 | $29,857 |
| 7 | New Haven, CT | 11.0% | $249,900 | $27,543 |
| 8 | Camden, NJ | 10.5% | $199,900 | $20,982 |
| 9 | Madison, WI | 10.5% | $239,300 | $25,062 |
| 10 | Fairfield County, CT | 10.4% | $535,000 | $55,593 |
| NOTE: Among the 55 U.S. metro areas where a bargain really means a bargain. To see the findings for these metros, click here. | ||||
On the other hand, seven of the 10 housing markets with the smallest discount are along the Costly Coasts. Riverside, Calif., comes to the bottom of the list, where bargain properties will get you just a 2.1%, or $6,480 discount off the median priced home. Homebuyers looking for bargain digs in the Pacific Northwest will only get a 2.8%, or $11,685 markdown, in Seattle and a 3%, or $9,238 cut in Portland, Ore.. Rounding out the bottom five are Orange County, Calif., and Montgomery-Bucks-Chester County, Pa., with a discount of 3.3%.

| Top 10 Housing Markets with Smallest Discount on Bargain Properties | ||||
| # | U.S. Metro | Discount % | Median Listing Price, Jan. 2013 – Dec. 2015 | Example Discount on Median Listing Price |
| 1 | Riverside-San Bernardino, CA | 2.1% | $310,000 | $6,480 |
| 2 | Seattle, WA | 2.8% | $419,950 | $11,685 |
| 3 | Portland, OR | 3.0% | $312,000 | $9,238 |
| 4 | Orange County, CA | 3.3% | $725,000 | $23,954 |
| 5 | Montgomery County-Bucks County-Chester County, PA | 3.3% | $324,900 | $10,815 |
| 6 | Houston, TX | 3.5% | $249,900 | $8,661 |
| 7 | Worcester, MA | 3.5% | $239,900 | $8,388 |
| 8 | Dallas, TX | 3.9% | $265,000 | $10,295 |
| 9 | Denver, CO | 3.9% | $350,000 | $13,680 |
| 10 | Washington, DC | 4.0% | $429,990 | $17,274 |
| NOTE: Among the 55 U.S. metro areas where a bargain really means a bargain. To see the findings forthese metros, click here. | ||||
In general, homebuyers in faster-appreciating and expensive markets can expect smaller discounts on bargain properties. This is due to the fact that in tighter markets, sellers don’t need to offer as many concessions – price or otherwise – when demand outstrips supply. However, in cooler markets with slower home price appreciation, the opposite is true. Buyers in such markets can be much pickier with the characteristics of their properties, so sellers are much more likely to offer discounts, accommodations, and concessions to prospective homebuyers.
While we find that a bargain really means a bargain in just 55 of the largest 100 housing markets, it doesn’t mean that bargains can’t be found in the other 45. Rather, it means that there are just as many bargain properties listed for less than the average property as there are listed for more. So buyer beware: in markets such as Los Angeles, Chicago, and San Francisco, that fixer-upper on the corner lot listed as a bargain might not actually be such a great deal.
Methodology
To determine whether for-sale listings being described as a bargain are actually a good deal, we tested whether there is a bargain effect on listing prices using a hedonic model. First, we looked at the all single-family homes listed for sale on Trulia in the 100 largest U.S. metros from January 2013 through December 2015 and identified which ones were described with the words “bargain,” “value,” “deal”and the phrases “under valued,” “fixer upper” and “under priced.”
We then estimated a hedonic model to determine the effect of the bargain term on the home’s listing price while controlling for the number of bedrooms, number of bathrooms, square feet, lot size, age, and zip code of each property. This allowed us estimate how much of a discount properties with a bargain term were listed for, on average, than similar properties within the same metro without a bargain term. We used a 10% level for statistical significance, and employed a 5% trimmed sample to reduce the effects of outliers on the regression estimates.
Only metros where the bargain term coefficient was significant were considered true bargain markets. Among the 100 largest U.S. metros that we examined, just 55 made the cut. We then calculated the average listing price discount for each of these 55 metros. For demonstrative purposes, we use the median listing price from January 2013 – December 2015 to show, on average, the discount in dollars on the median priced home.


