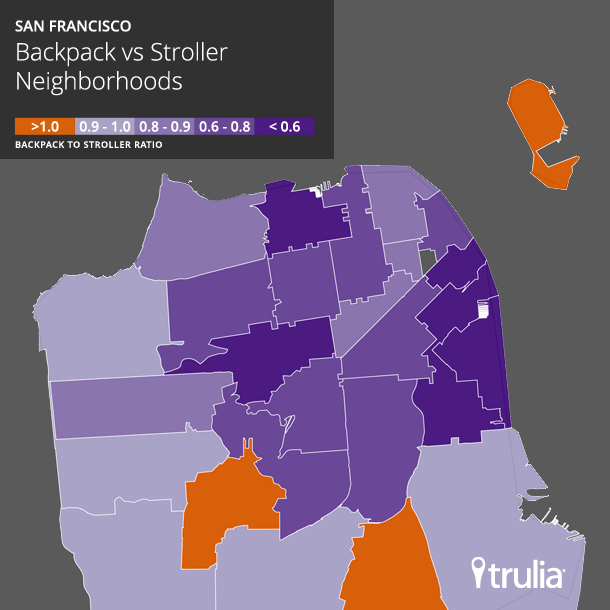
Summer is ending, and kids across the country are grabbing their backpacks and trudging off to school. In many suburban neighborhoods, the backpacks come out in full force. But in some city neighborhoods – even those where the sidewalks are full of strollers – backpack-toting kids are scarce. That’s because many urban parents move to the suburbs once their kids are ready to enroll in school.
Education is clearly top of mind when parents decide to relocate. Among adults who live with children, nearly two thirds (63%) said a neighborhood’s school district would be among the most important considerations (aside from the home’s price) when searching for a home – but few adults without kids would take school districts into account:
| Consideration in home search | Has Children | No Children | Difference |
| Size of home |
70% |
66% |
3% |
| Neighborhood Crime Rates |
69% |
65% |
4% |
| Neighborhood School Districts |
63% |
20% |
42% |
| Length of Commute to Office/Work |
58% |
46% |
12% |
| Home’s Proximity to Amenities |
50% |
59% |
-9% |
| Age of Home |
47% |
49% |
-2% |
| Area’s Likelihood of Natural Disasters |
35% |
37% |
-3% |
| Proximity of Home to External Family |
33% |
29% |
5% |
| Pet Friendly Home Accommodations |
32% |
32% |
0% |
| Note: Trulia worked with Harris Interactive to conduct an online survey of 2,029 U.S. adults from June 24-26, 2013. Respondents were asked “Other than the price of the home, which of the following considerations, if any, would be among the most important to you, if you were searching for a home? Please check all that apply.” For the full methodology, see below. Note that numbers are rounded and may not add perfectly as a result. | |||
More Backpacks or More Strollers in the Neighborhood?
Parents with kids want larger homes, safer neighborhoods, and better schools. Data from the 2010 Census on where families live show how these desires actually play out. To see which neighborhoods families choose to live in as their kids approach school age, we looked at the relative populations of children aged 0-4 and 5-9. Nationally, there are just about as many elementary-school-age kids (those between 5 and 9 – let’s call them “backpacks”) as there are preschoolers (kids from 0 to 4 – “strollers”). In other words, the ratio of backpacks to strollers is very close to 1 – to be precise, it’s 1.01. (Of course, older kids have backpacks too, and not every kid age 0-4 is in a stroller. But you get the point.) Spelling it out more clearly:
- A neighborhood with a ratio below 1 (i.e., more strollers than backpacks) indicates that more families are moving out of that area than moving in as children reach school age
- A neighborhood with a ratio above 1 (i.e. more backpacks than strollers) indicates that more families are moving into that area than moving out as children reach school age
As we showed last year, the most “attractive” school districts – those with the highest backpack-to-stroller ratio – are smaller, suburban districts, while big-city school districts have more strollers than backpacks. But even within big cities, there’s huge variation: New York, Los Angeles, Chicago, and other cities all have extreme “stroller” neighborhoods, where the preschoolers far outnumber the elementary-school-age kids, but also a few “backpack” neighborhoods, which have more elementary school-age kids than preschoolers. Even in cities like San Francisco, where a lottery often assigns kids to elementary schools outside their own neighborhood, some neighborhoods are much more attractive to families with school-age kids than others are.
The Extreme “Stroller” Neighborhoods
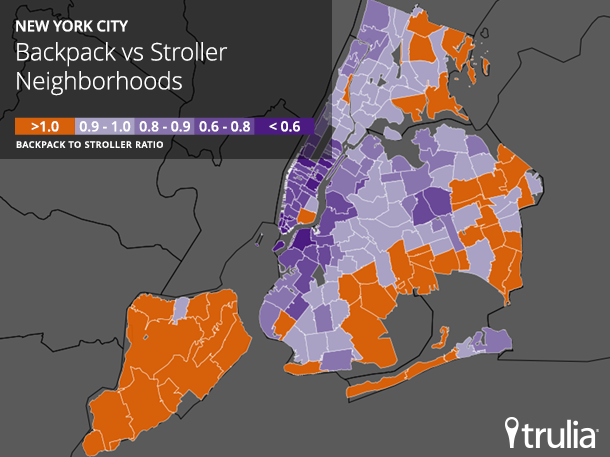
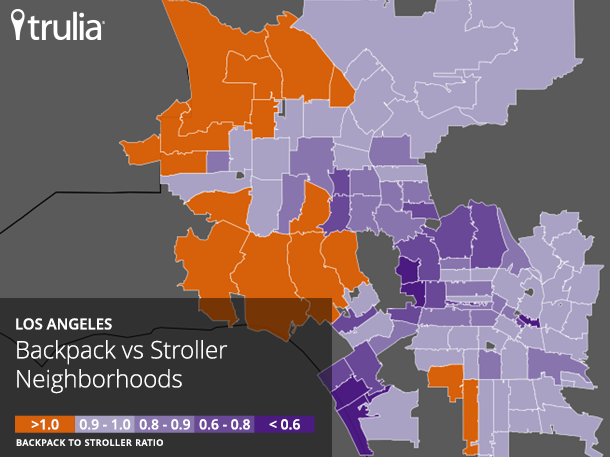
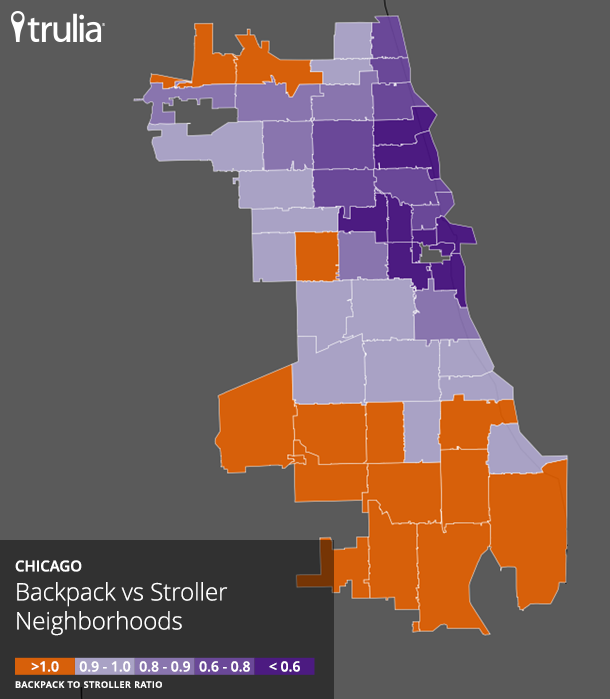
There are few elementary-school-age kids to be found in the most extreme “stroller” city neighborhoods. In New York, for example, there are far more strollers than backpacks (i.e., the ratio of 5-to-9 year-olds to 0-to-4 year-olds is well below 1) in the Financial District (ZIP codes 10005 and 10006) and Long Island City, Queens, along with the Midtown neighborhoods of the East 40s (10017) and the West 50s (10019). Same with the Los Angeles neighborhoods of Playa Vista (90094), Hollywood Hills/West Hollywood (90069), Marina del Rey (90292), the Beverly Center area (90048), and Century City (90067). Chicago’s Loop and River North (60654) also have far more strollers than backpacks.
In general, the more expensive, higher-density, urban neighborhoods are the most extreme stroller neighborhoods. These are the neighborhoods that families are most likely to leave when the kids reach school age.
| City | Top 3 “Stroller” Neighborhoods |
Backpack-to-Stroller Ratio |
| New York | 11109 (Long Island City, Queens) |
0.27 |
| 10006 (Financial District/World Trade Center) |
0.33 |
|
| 10005 (Financial District/Wall Street) |
0.33 |
|
| Los Angeles | 90094 (Playa Vista) |
0.30 |
| 90069 (Hollywood Hills/West Hollywood) |
0.50 |
|
| 90292 (Marina del Rey) |
0.55 |
|
| Chicago | 60661 (West Loop) |
0.22 |
| 60654 (River North) |
0.25 |
|
| 60605 (South Loop) |
0.39 |
|
| Miami | 33131 (Brickell) |
0.40 |
| 33132 (Wynwood/Edgewater/Dodge Island) |
0.45 |
|
| 33139 (Miami Beach/South Beach) |
0.61 |
|
| San Francisco | 94105 (South Beach/SOMA) |
0.26 |
| 94158 (Mission Bay) |
0.52 |
|
| 94107 (Potrero Hill/Dogpatch/SOMA) |
0.52 |
|
| Houston | 77054 (Astrodome) |
0.46 |
| 77002 (Downtown) |
0.51 |
|
| 77006 (Neartown/Montrose) |
0.55 |
|
| Dallas | 75201 (Arts District) |
0.54 |
| 75206 (Lower Greenville) |
0.63 |
|
| 75001 (Addison) |
0.64 |
|
| Philadelphia | 19106 (Society Hill/Independence Mall) |
0.44 |
| 19103 (Fitler Square/Rittenhouse Square) |
0.50 |
|
| 19130 (Fairmount/Art Museum) |
0.57 |
|
| Boston | 02215 (Fenway/Kenmore) |
0.33 |
| 02116 (Back Bay) |
0.49 |
|
| 02114 (West End) |
0.49 |
|
| Washington, DC | 20037 (Foggy Bottom) |
0.22 |
| 20005 (Logan Circle) |
0.47 |
|
| 20009 (Columbia Heights/Adams Morgan) |
0.56 |
|
| Note: the “backpack-to-stroller ratio” equals the number of 5-9 year olds divided by the number of 0-4 year olds living in the ZIP code. Only neighborhoods within the city school district were included. | ||
Where the “Backpack” Neighborhoods Are
Plenty of parents stay in the city when their kids reach school age – and within each urban school district there are a few neighborhoods that draw in these “backpack” families. Unlike the extreme stroller neighborhoods, backpack neighborhoods tend to be more affordable and are lower density – in other words, fewer high-rises and more single-family homes. In city school districts where kids are assigned to a neighborhood elementary school, better-quality schools are a big draw.
In Los Angeles, two types of city neighborhoods have more backpacks than strollers: the pricey Westside neighborhoods of Topanga Canyon (90290), Pacific Palisades (90272), and Bel Air (90077), and the northern and western San Fernando Valley neighborhoods of West Hills/Bell Canyon (91307) and Porter Ranch (91326). (We’re looking only at neighborhoods within the Los Angeles Unified School District; other school districts in L.A. County, like San Marino, La Canada, and Palos Verdes also have a high backpack-to-stroller ratio.)
In New York, some of the outermost neighborhoods have more school kids: the backpack-to-stroller ratio is highest in Staten Island’s Tottenville neighborhood (10307) and Queens’s Douglaston (11363) and Breezy Point/Roxbury (11697) neighborhoods. In big cities, the backpack neighborhoods are few and far between – but every big-city school district has at least one neighborhood with more backpacks than strollers.
| City | Top 3 “Stroller” Neighborhoods |
Backpack-to-Stroller Ratio |
| New York | 11363 (Douglaston, Queens) |
1.36 |
| 10307 (Tottenville, Staten Island) |
1.31 |
|
| 11697 (Breezy Point/Roxbury, Queens) |
1.19 |
|
| Los Angeles | 90290 (Topanga) |
1.40 |
| 91307 (West Hills/Bell Canyon) |
1.32 |
|
| 90272 (Pacific Palisades) |
1.29 |
|
| Chicago | 60643 (Morgan Park) |
1.18 |
| 60652 (Ashburn) |
1.16 |
|
| 60631 (Norwood Park) |
1.13 |
|
| Miami | 33158 (Deering Bay) |
1.52 |
| 33156 (Pinecrest) |
1.45 |
|
| 33149 (Key Biscayne) |
1.31 |
|
| San Francisco | 94130 (Treasure Island) |
1.18 |
| 94134 (Visitacion Valley) |
1.08 |
|
| 94127 (Miraloma/West Portal) |
1.02 |
|
| Houston | 77401 (Bellaire) |
1.22 |
| 77005 (University Place/West University Place) |
1.13 |
|
| 77085 (Central Southwest) |
1.08 |
|
| Dallas | 75241 (Southeast Oak Cliff) |
1.08 |
| 75159 (Seagoville) |
1.08 |
|
| 75233 (Redbird) |
1.01 |
|
| Philadelphia | 19126 (West Oak Lane/East Oak Lane) |
1.06 |
| 19151 (Overbrook) |
1.05 |
|
| 19137 (Bridesburg) |
1.03 |
|
| Boston | 02126 (Mattapan) |
1.02 |
| Washington, DC | 20015 (Chevy Chase) |
1.08 |
| Note: the “backpack-to-stroller ratio” equals the number of 5-9 year olds divided by the number of 0-4 year olds living in the ZIP code. Only neighborhoods within the city school district were included. Some cities have fewer than three “backpack” neighborhoods. | ||
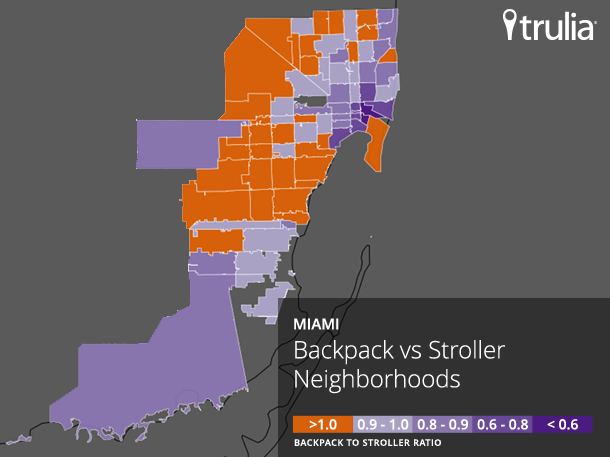
Mapping five of the big-city school districts makes it clear: backpack neighborhoods tend to be lower density and nearer to suburban boundaries. The extreme stroller neighborhoods tend to be in or near downtown city centers. Even when parents don’t move out of the city to the actual suburbs, parents tend to move from the city’s core outward to quieter city neighborhoods when the kids reach school age.
In the Housing Recovery, “Stroller” Neighborhoods are Out Ahead
If parents of school-age kids were the only people buying or renting homes, then backpack neighborhoods would be in high demand. But they’re not. In fact, during the past year’s housing recovery, stroller neighborhoods have seen bigger gains in home prices and search traffic on Trulia than backpack neighborhoods have. In New York City, for instance, the change in asking home prices per square foot was +11% in extreme stroller neighborhoods (those with a backpack-to-stroller ratio under .75) and just +0.3% in backpack neighborhoods (backpack-to-stroller ratio over 1).
The backpack neighborhoods, therefore, might be the place to look if you’ve got kids approaching school age and want to stay in the big city. But if you’re looking for neighborhoods where the housing market is hot, follow the strollers, not the backpacks.
SURVEY METHODOLOGY
The survey referenced above was conducted online within the United States by Harris Interactive on behalf of Trulia from June 24-26, 2013 among 2,029 adults ages 18 and older. This online survey is not based on a probability sample and therefore no estimate of theoretical sampling error can be calculated. For complete survey methodology, including weighting variables, please contact pr@trulia.com.
