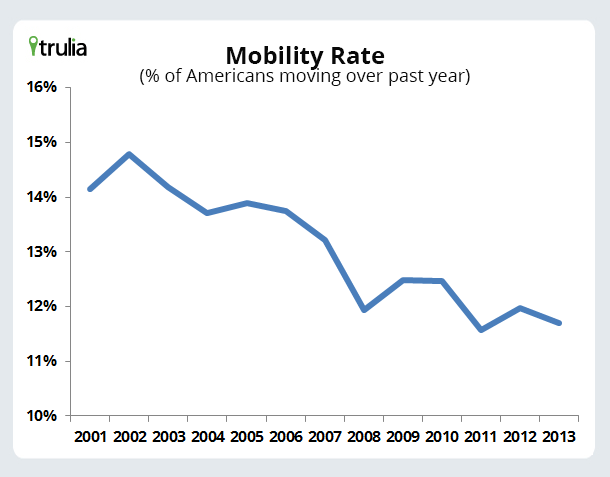
Americans move less than they used to. The percentage of Americans moving each year has dropped from 20% during the 1950s and 1960s, down to about 14% before and during the 2000s housing bubble, and then to a low point of 11.6% in 2011. The drop in mobility means that Americans are staying in the same house longer between moves: from 5 years, on average, in the 1950s and 1960s, to about 7 years before and during the bubble, and 8.6 years in 2013.
Last year the Census reported an increase in mobility in 2012 to 12.0%, led by an increase in longer-distance moves. However, new 2013 data suggest that the mobility rebound we saw in 2012 might have been short-lived.
Mobility is Back Down in 2013
Using the Current Population Survey (CPS) microdata that underlie the published Census mobility tables and report (see note below), we found that mobility in 2013 dropped back down to 11.7%, just slightly above the 2011 all-time low of 11.6%. Clearly, Americans are not yet back on the move.
This graph shows the percent of Americans who moved in the past twelve months, as of March of each year.
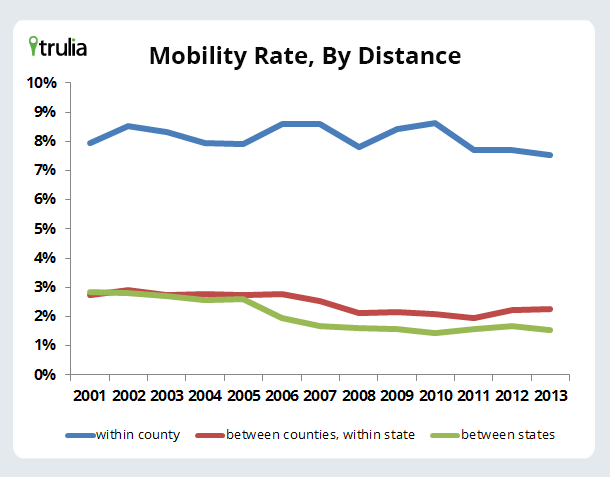
In 2013, short-distance moves (within-county) are at an all-time low – just 7.5% of Americans made this type of move in the past year. By comparison, longer-distance moves – between counties within the same state, and between states – have rebounded a bit from their low points in 2011 and 2010, respectively. But these longer-distance moves are still much less common now than before the housing bubble burst.
Short Moves are for Housing, But Long Moves are for Jobs
A further look at why people move helps explain the mobility trends. The CPS asks movers to select their primary reason for moving among 19 different options across four categories: family reasons (e.g. getting married), job reasons (e.g. new job, shorter commute), housing reasons (e.g. wanted better home, wanted cheaper home), and other reasons.
The reasons for moving are closely tied to the distance of the move: most within-county moves are for housing reasons, while nearly half of between-state moves are for job reasons. Looking at specific job and housing reasons shows the relationship between distance and reasons even more clearly: for instance, a new job or job transfer is the main reason for just 3% of within-county moves, but 32% of between-state moves.
|
Within county |
Between counties, same state |
Between states |
|
| Broad category: | |||
| Family reasons |
30% |
32% |
30% |
| Job reasons |
11% |
27% |
47% |
| Housing reasons |
58% |
39% |
20% |
| Selected specific reasons: | |||
| New job or job transfer |
3% |
12% |
32% |
| Wanted new or better housing |
19% |
10% |
3% |
| Wanted cheaper housing |
11% |
6% |
3% |
| Wanted own home, not rent |
7% |
5% |
1% |
| Note: nearly all of the reasons for moving fell into one of the three broad categories. The “other reasons” category accounted for 2% of all moves. The four selected specific reasons shown are the most common housing-related and job-related reasons. | |||
The Reasons for Moving Change with the Recovery
The reasons for moving help explain why mobility is recovering slowly, and why longer-distance moves are picking up more quickly than shorter-distance moves. Although the overall trend in mobility is downward, each reason for moving has its own ups and downs.
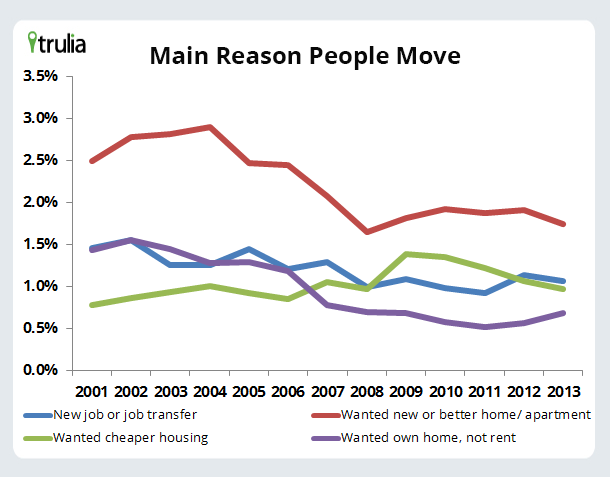
As the housing bubble was forming in 2003 and 2004, there was an increase in the share of Americans moving because they wanted a new or better home.
After the bubble burst, there was a big drop in moving for a new or better home, as well as a big drop in moving in order to become homeowners instead of renters. Also, during the recession, fewer people moved for new jobs or job transfers since there weren’t as many new jobs to move to. The one reason people moved more during the recession was for cheaper housing. While moving for new or better housing peaked in 2004, moving for cheaper housing peaked in 2009 and 2010. In fact, in 2009, 2010, and 2011, more people moved for cheaper housing than for a new job – a reversal from the pre-recession years.
In 2012 and 2013, as the housing market and economy recover, an increasing share of people are moving for new jobs and to become homeowners. But, with rising home prices, there’s been a decline in the share of people moving for cheaper housing. The graph shows this:
Note: the graph shows the percent of all Americans – not just movers – moving in the past year for a specific reason. Also, “foreclosure/eviction” was added to the survey starting in 2011 as a reason for moving, which might have affected the trends in other categories.
All in all, the recovery is having a mixed effect on American mobility. As the job market picks up, more Americans will move, particularly longer-distances, but the job recovery is still slow. Furthermore, fewer people are on the move for cheaper housing. As a result, mobility took a step back in 2013 after increasing in 2012. As the recovery continues, we should at least see an increase in longer-distance moves, but with the many-decade decline in mobility, it’s unclear when or if mobility will return to pre-bubble levels.
Note: This blogpost is based on the Annual Social and Economic Supplement (ASEC) of the Current Population Survey (CPS), which is conducted in March of each year by the Census and the Bureau of Labor Statistics. The 2013 ASEC microdata have been released, but the published summary tables on mobility and migration for 2013 have not, as of late September 2013.


