- In seven large metros– San Francisco, San Jose, Los Angeles, San Diego, Portland, Ore., Miami and Tampa – there is not a single ZIP code in which 100% of homes could be considered affordable to a typical local buyer.
- Pittsburgh, Columbus, Ohio, and St. Louis are the metros with the largest share of ZIP codes in which 100% of homes are affordable: 22.4%, 19.1% and 18.2% of ZIP codes, respectively.
- The share of homes determined to be affordable in ZIP codes within 30 miles of the city center is, on average, 14 percentage points lower than in those ZIPs 30 miles or farther from downtown.
- The share of affordable homes in ZIP codes where the median age of homes is less than 20 years old is, on average, 13 percentage points lower than in ZIP codes with homes older than 20 years.
As housing affordability continues to worsen, many buyers may feel as though the very idea of an affordable neighborhood has long since gone the way of the Dodo. But the fact is, pockets of affordable homes can be found in every one of the nation’s largest metros – and in some neighborhoods, virtually every home is reasonably affordable[1] to typical buyers.
And not only are these islands of affordability fairly widespread, identifying them can often be as simple as noting their proximity to their metro’s downtown core and to the age of the homes within them.
Each of the country’s 50 largest markets had at least one ZIP code where half or more homes were deemed to be affordable to a would-be buyer earning the local median income. But there were also extremes. Of the more than 8,000 ZIP codes examined, 261 are completely out of reach for the typical income earner: no homes are affordable. But there are more than twice as many ZIP codes (604) scattered across the country where all homes are affordable.
Pricey Metros, Unaffordable ZIP Codes
It’s likely no surprise that the nation’s priciest metros tend to be home to the biggest shares of entirely unaffordable ZIPs. Of the 50 markets analyzed, San Francisco, San Jose and Los Angeles – all among the country’s most-expensive housing markets – have the highest share of ZIP codes in which no homes (0%) are reasonably affordable to workaday home buyers: 23.5%, 19% and 15.9%, respectively.
| U.S. Metro | Share of ZIPS where 100% of Homes are Unaffordable | Median Home Value | Median Income |
| San Francisco, CA | 23.5% | $946,700 | $101,000 |
| San Jose, CA | 19.0% | $1,193,600 | $120,000 |
| Los Angeles | 15.9% | $649,500 | $70,000 |
| New York, NY | 9.3% | $442,500 | $75,700 |
| San Diego, CA | 8.0% | $590,700 | $75,110 |
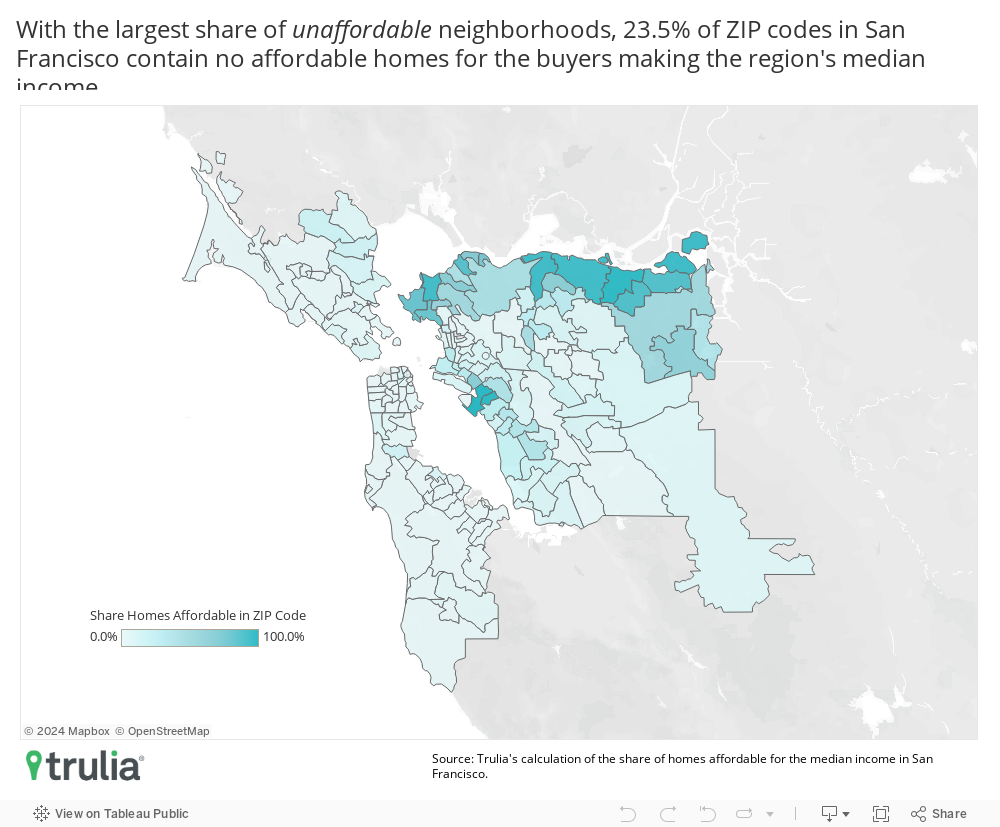
This makes sense, since some of the local ZIPs in these markets are also some of the most famously posh areas of the country. The nation’s most expensive ZIP code (90263, with a median home value of almost $7.8 million) is in Malibu, Calif., part of the greater Los Angeles metro and home to many a celebrity’s beachside estate. Other California neighborhoods off-limits to mere mortals include 94027 in Atherton, Calif. – halfway between San Francisco and San Jose – and perhaps the country’s most famous ZIP code: Beverly Hills’ 90210.
Affordability is More Common than Not
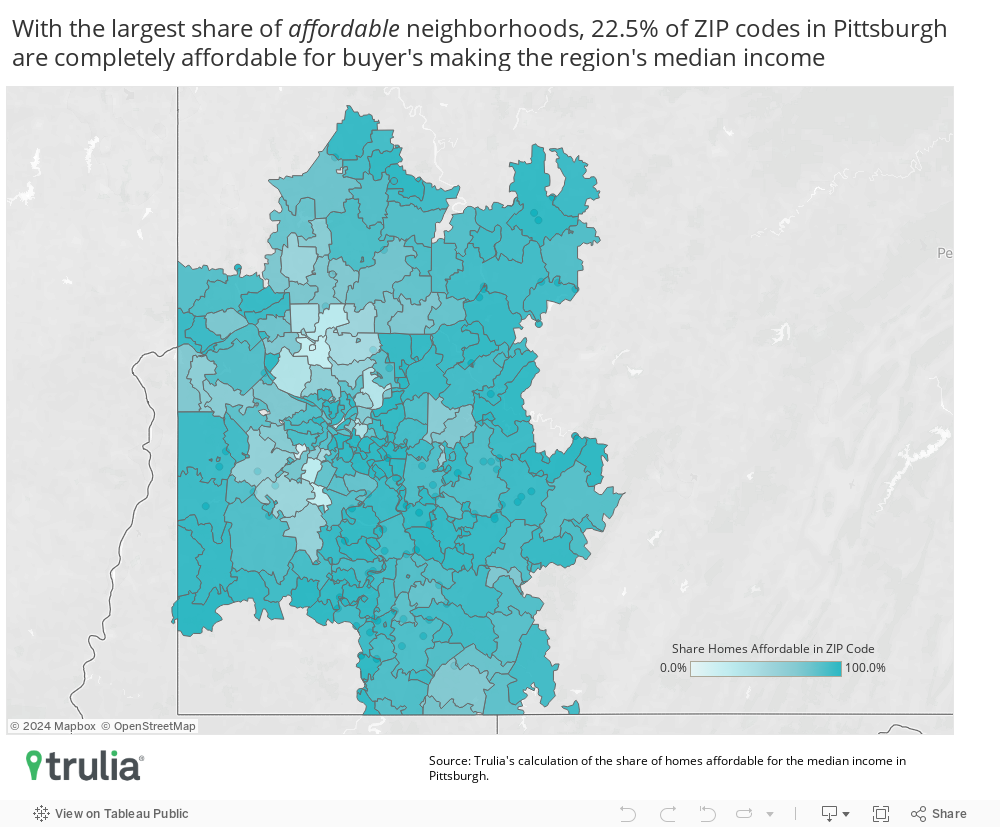
But while these entirely unaffordable ZIP codes are daunting to most of us, they are scarcer than places where 100% of homes are affordable. There are more than twice as many ZIP codes where all homes are affordable than not, and there are nine metros where the share of ZIP codes that are 100% affordable is in the double digits.
Metros with the largest share of completely affordable neighborhoods are Pittsburgh, Columbus, Ohio, and St. Louis where the median income earner can afford 100% of homes in 22.4%, 19.1% and 18.2% of ZIP codes, respectively. Perhaps not coincidentally, median home values in these metros are among the lowest of the 50 markets examined.
| U.S. Metro | Share of ZIPS where 100% of Homes are Affordable | Median Home Value | Median Income |
| Pittsburgh, PA | 22.5% | $143,200 | $59,000 |
| Columbus, OH | 19.1% | $192,000 | $64,480 |
| St. Louis, MO | 18.2% | $166,500 | $60,900 |
| Kansas City, MO | 16.4% | $192,900 | $62,600 |
| Indianapolis, IN | 13.9% | $166,800 | $60,000 |
Downtown Proximity, Age of Homes Matter When Seeking Affordable Communities
So, to re-state what might be obvious: The odds of finding affordable communities are better in markets that are less-expensive to begin with. But less obvious is the fact that across all metros examined – regardless how pricey – we found that the most affordable communities tend to be located farther away from the city center and are comprised of older homes.
Looking at all ZIP codes across the 50 largest metros, the share of affordable homes in those located within 30 miles of the city center is 14 percentage points less, on average, than in those ZIP codes more than 30 miles from downtown. A location closer to the center of the city tends to fetch a premium since that often means lower commuting costs (in both time and money), and land values tend to be higher closer to a given metro’s center of gravity.
Likewise, ZIP codes with newer homes also tend to be less affordable, especially those in which the bulk of local homes were built in the last two decades. The share of homes determined to be affordable in ZIP codes where the median age of a home is 20 years or less is 13 percentage points lower, on average, than in ZIP codes where the median age of homes is more than 20 years.
[1] For every ZIP code in each of the country’s 50 largest markets, Trulia calculated the share of homes affordable to a would-be buyer earning the local median income in a given area. We assume this buyer has saved a 20 percent down payment on the median-priced home in an area and is financing the rest of the purchase with a 30-year, fixed-rate mortgaged at currently prevailing rates. We defined a home as “affordable” if monthly mortgage payments and expenses including property taxes did not consume more than 30 percent of that buyer’s income – a threshold long recommended by housing experts and advisers.
Methodology
We took the current value of all homes (as of April 2019) in the largest 50 metro areas and calculated the share affordable in each ZIP code to a would-be buyer that earns the local median income. Homes were considered affordable if 30% or less of the metro’s median monthly income was required to afford a mortgage payment and other expenses, including property taxes, on that home.
In order to find the share of affordable homes on the market, we calculated the maximum amount that the median income could allocate towards a mortgage payment. We evaluated the value of each home, subtracted a 20% down payment and calculated the monthly mortgage payment using the prevailing 30-year fixed mortgage rate (according to Freddie Mac’s Primary Mortgage Market Survey). We also factored in mortgage insurance and property taxes. Based on these calculations, we determined the share of homes that were affordable without exceeding 30% of the median monthly income for that metro. Median household income is based on the U.S. Census’ 2017 1-Year American Community Survey.
Distance measures are calculated based on Euclidean distances between the centroid of a ZIP code and the nearest central business district (CBD). The coordinates for these CBDs are from “Accounting for Central Neighborhood Change, 1980-2010” (Baum-Snow and Hartley, 2016). To estimate the relationship between the distance of a ZIP code from the city center and the share of affordable homes, we regressed ZIP codes with an indicator of whether its distance is within 30 miles on the share of affordable homes and included metro fixed effects. Likewise, to estimate the relationship between the median age of homes in a ZIP code and the share of affordable homes, we regressed ZIP codes with an indicator of whether its age is 20 years or less on the share of affordable homes and included metro fixed effects.

