
They are the people we depend upon even if we don’t see them every day: teachers, first responders, restaurant workers and doctors. But for the majority of them who live in America’s biggest housing markets, buying a home in the community they serve is getting harder – and in a few places, out of reach.
As for closely watched tech workers? It turns out programmers find most markets unaffordable, too.
This year we revisit our report that examined how many homes on the market doctors, teachers, first responders and restaurant workers could afford. The news is discouraging. Workers in these roles are finding it even harder to live in the communities they serve.
Using the latest median wage data for each occupation group from the Labor Department’s recently-released employment report, we calculated the share of homes for sale in each market that are affordable to each category of worker. We define affordability as having a debt-to-income ratio of 31% or less, which means one’s monthly payment on housing would take up no more than 31% of one’s paycheck. We assume that borrowers can put down a 20% down payment for a 30-year fixed rate mortgage at a 4.44% interest rate. We also include any homeowners’ association fees on the property, property tax and insurance into the affordability calculation (see the methodology below for more details). We found:
- Teachers are worse off or the same in 85 of the largest 93 metros, where the share of listings that teachers can afford decreased or held steady since this same time last year. And in the eight metros where the share of affordable listings increased, only four increased by more than 1 percentage point.
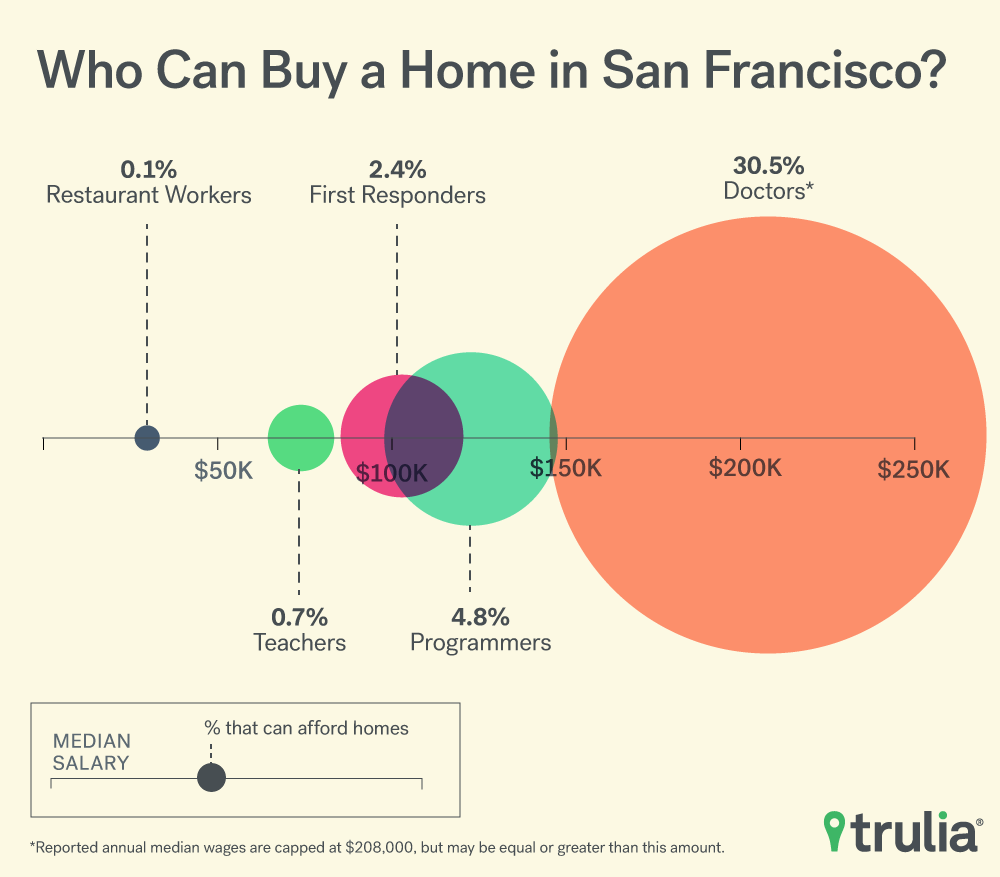
- First responders have the toughest time finding a home they can afford to purchase in expensive California cities. Despite earning more than $100,000 in San Francisco and San Jose first responders can afford just 2.4% and 6.6% of currently listed homes, respectively.
- Restaurant workers, as the lowest wage earners among the occupations studied, continue to face the greatest challenges when it comes to affording a home. In 61 out of 93 markets this year, the share of homes affordable to restaurant workers is in the single digits, up from 56 markets last year.
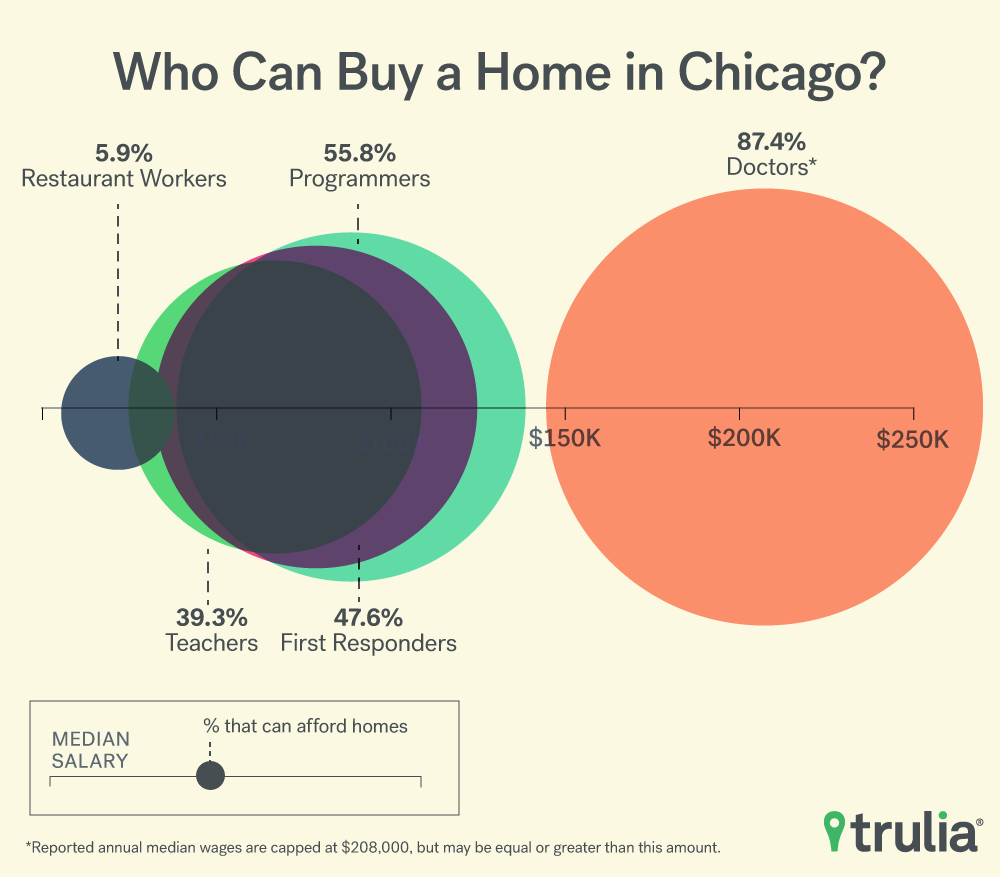
- Computer programmers have been at the center of a conversation about housing affordability and increasing scarcity in tech hotspots like the San Francisco-Bay Area and Seattle. But they, too, were unable to afford a majority of homes in these markets. In San Francisco, San Jose, Calif., Oakland, Calif., and Seattle programmers earned six-figures but could only afford 4.8%, 11.8%, 19.7% and 39.0% of all homes, respectively.
Teachers Continue to Struggle to Afford to Live in the Communities They Educate
Teachers are worse off in nearly all metros covered in this study. In only eight markets was there a greater share of listings affordable for teachers. However, in just four of those markets did that number increase by more than one percentage point, including El Paso, Texas (5.7 percentage points), Bakersfield, Calif. (3.0 p.p.), Virginia Beach-Norfolk, Va. (2.1 p.p.), and Montgomery-Bucks-Chester Counties, Pa. (1.6 p.p.). Wage growth outpaced listing price growth in all of these markets except Bakersfield, and all four of these markets were in the top five places which saw the largest increase in teacher wage growth.
Top 10 Metros with Greatest Increase in Share of Affordable Homes for Teachers
| Metro | Percent Change in Median Wage (2016-2017) | Percentage of For-Sale Homes Affordable for Teachers (2018) | Percent Change in List Price (2017-2018) | Percentage Point Change in Share of Affordable Homes (2017-2018) |
| El Paso, TX | 12.8% | 82.7% | 4.9% | 5.7% |
| Bakersfield, CA | 14.1% | 79.5% | 15.3% | 3.0% |
| Virginia Beach-Norfolk, VA | 14.4% | 64.4% | 8.1% | 2.1% |
| Montgomery-Bucks-Chester Counties, PA | 11.0% | 43.6% | 8.3% | 1.6% |
| San Antonio, TX | 2.3% | 36.2% | -0.3% | 0.7% |
| Honolulu, HI | 3.8% | 17.2% | -5.9% | 0.5% |
| Baltimore, MD | 7.9% | 49.4% | 3.3% | 0.4% |
| San Francisco, CA | 2.6% | 0.7% | 18.3% | 0.3% |
| San Jose, CA | 1.1% | 2.0% | 30.6% | 0.0% |
| Syracuse, NY | 2.2% | 75.9% | 8.5% | -0.1% |
Markets where teachers fare worse this year than last were most likely to see housing prices outpace wages. More than one-quarter of the 93 metros saw a double-digit decrease in the share of homes affordable to teachers, led by Tacoma, Wash. (-24.4 percentage points), Colorado Springs, Colo. (-21.7 p.p.) and Indianapolis, Ind. (-17.3 p.p.). Tacoma and Indianapolis are also the markets that led home prices changes since last year.
Top 10 Metros with Greatest Decrease in Share of Affordable Homes for Teachers
| Metro | Percent Change in Median Wage (2016-2017) | Percentage of For-Sale Homes Affordable for Teachers (2018) | Percent Change in List Price (2017-2018) | Percentage Point Change in Share of Affordable Homes (2017-2018) |
| Tacoma, WA | 2.1% | 25.8% | 42.9% | -24.4% |
| Colorado Springs, CO | 2.2% | 10.0% | 29.1% | -21.7% |
| Indianapolis, IN | 2.0% | 46.9% | 39.2% | -17.3% |
| Grand Rapids, MI | -0.7% | 49.4% | 18.9% | -16.6% |
| Salt Lake City, UT | -0.7% | 18.4% | 9.6% | -16.4% |
| Atlanta, GA | -0.6% | 37.5% | 22.8% | -15.6% |
| Minneapolis-St. Paul, MN | 3.3% | 32.7% | 20.3% | -14.8% |
| Omaha, NE | 1.8% | 36.4% | 25.3% | -14.4% |
| Richmond, VA | -5.2% | 37.0% | 10.0% | -13.3% |
| Rochester, NY | 5.0% | 56.4% | 34.2% | -13.1% |
First Responders Priced-Out in California; Housing Affordability Slips for Restaurant Workers
Last year, first responders could afford more than half of listings in 43 markets but that number has dwindled to 27 markets even though wages increased for police officers and firefighters in 77 markets. In San Jose, Calif., San Francisco, and Oakland, Calif. first responders earn more than $100,000 but can afford 2.4%, 6.6% and 14.8% of available listings, respectively.
Restaurant workers received some positive news this year as the share of homes they can afford in Detroit went up to 50.6%, which increased from last year’s market-leading 42.9%. However, this was largely attributed to the median listing price in Detroit dropping 19%. Elsewhere, the share of homes restaurant workers can afford are in the single digits in 61 markets, up from 56 last year.
Tech Hotspots Vex Even Computer Programmers
How Programmers Fare in Tech Hotspots
| Metro | Median Annual Wage (2017) | Median Listing Price (2018) | Share of Listings Affordable to Programmers |
| San Francisco, CA | $122,923 | $1,477,038 | 4.8% |
| Seattle, WA | $117,798 | $675,000 | 39.0% |
| San Jose, CA | $115,660 | $1,199,000 | 11.8% |
| Oakland, CA | $110,400 | $795,000 | 19.7% |
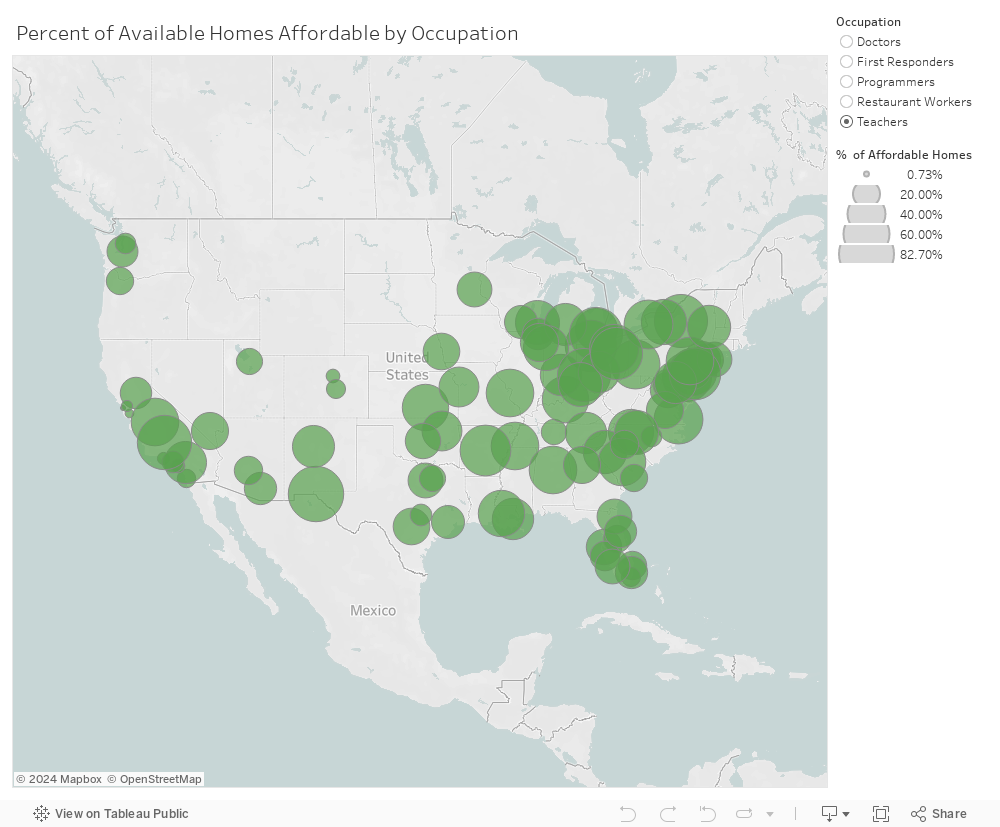
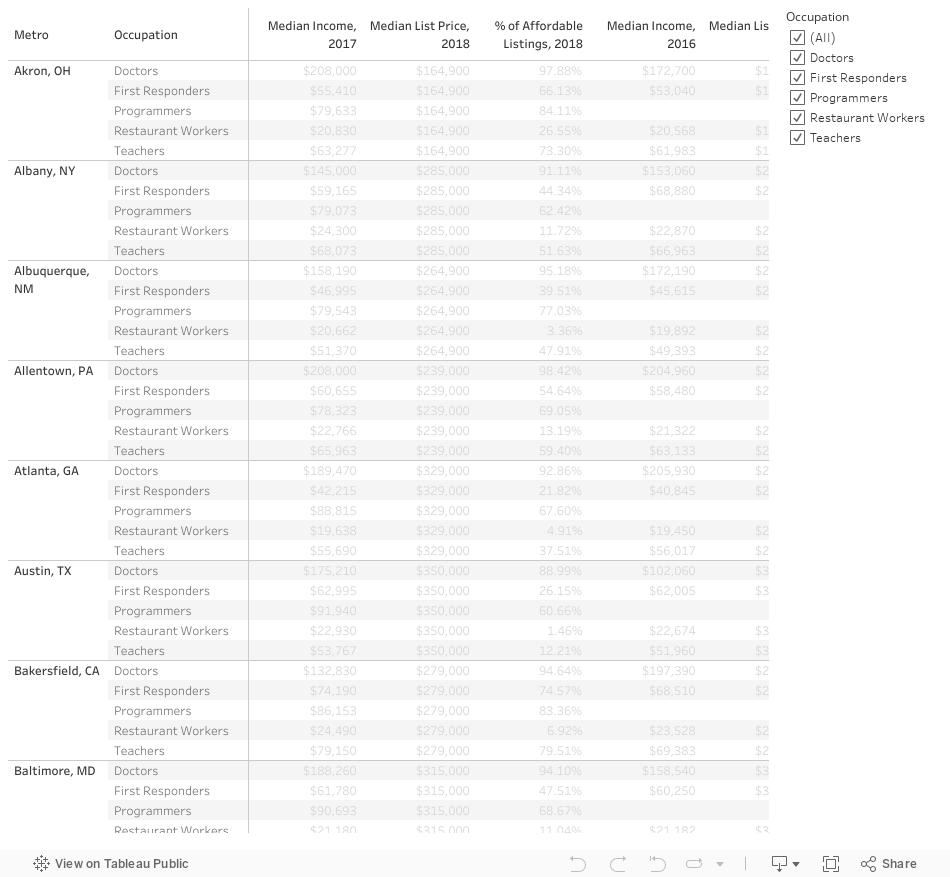
Housing Affordability Across America’s Biggest Housing Markets, By Select Occupations
Methodology
Wage figures used in this report are from the Bureau of Labor Statistics Occupational Employment Statistics for May 2017. Teachers here include elementary, middle and secondary school teachers and the median income is calculated by taking the average of these sub-categories. Restaurant workers include cooks, food preparation workers, bartenders, and waiters and waitresses. First responders include police and sheriff’s patrol officers and firefighters. Doctors here are family and general practitioners. Programmers include computer programmers, software developers (applications), software developers (systems software) and web developers.
Affordability is defined as spending 31% or less of one’s monthly income on housing. In order to find the share of affordable homes on the market for the median income earner for each occupation we calculate the maximum amount that each person can allocate towards a mortgage payment based on their wage. We evaluated the listing price of each home effective March 29. We subtracted a 20% down payment and calculated the monthly mortgage payment using the prevailing 30-year mortgage rate (4.44%) at that time. We also considered HOA fees, mortgage insurance and property taxes. Finally, we took the number of listed properties that the median income earner for each occupation could afford.

