
New Yorkers get rankled by noise — be it loud music and parties or banging or loud TVS — while San Franciscans can’t stand graffiti and garbage.
New York and San Francisco are two of the nation’s most expensive big city housing markets. But pricey mortgages and steep rents aren’t the only burdens residents deal with. Each city has its own nuisances that drive locals crazy.
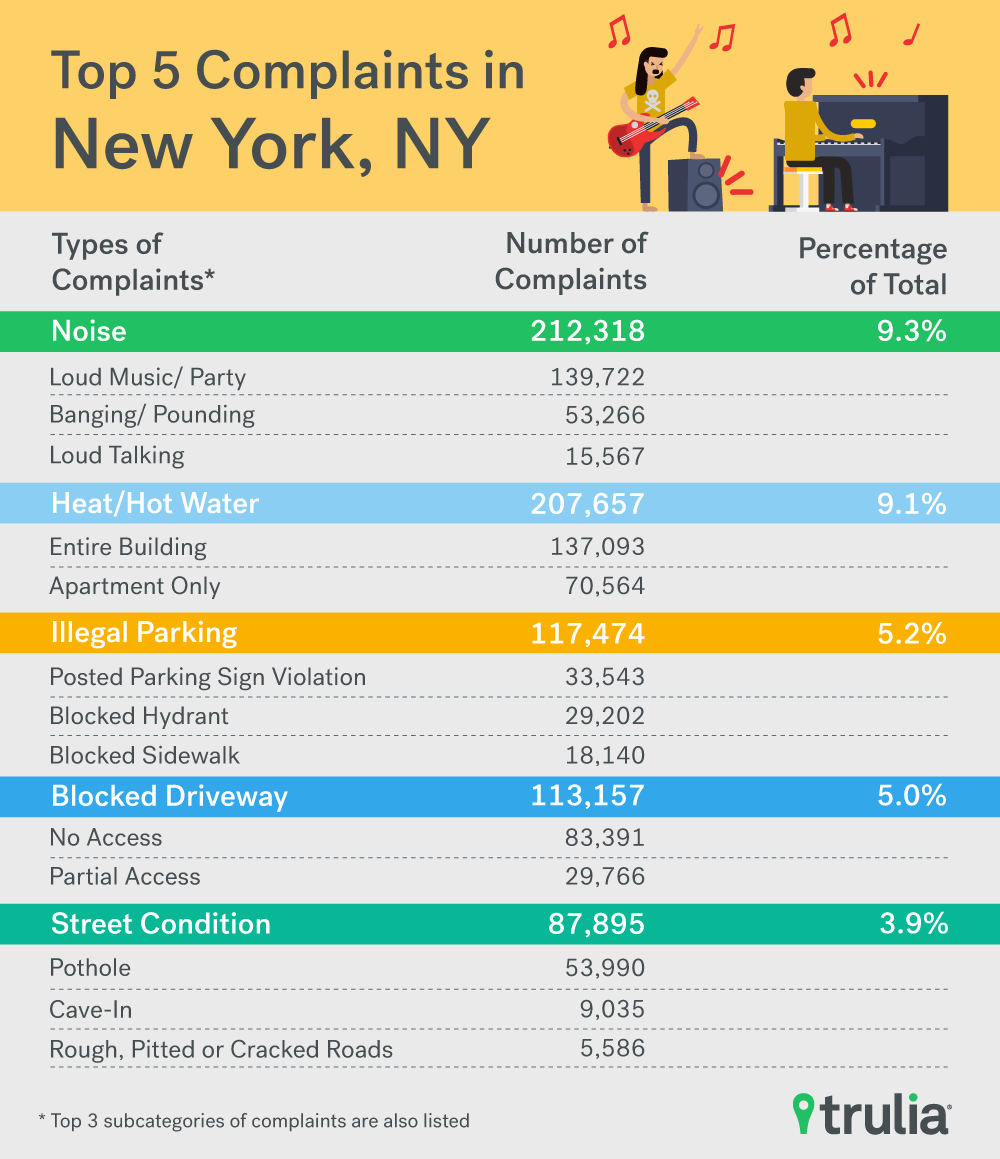
In short, New Yorkers could use some earplugs. They mostly complain about noise. Loud music and parties rank first, followed by banging, loud TVs and loud voices.
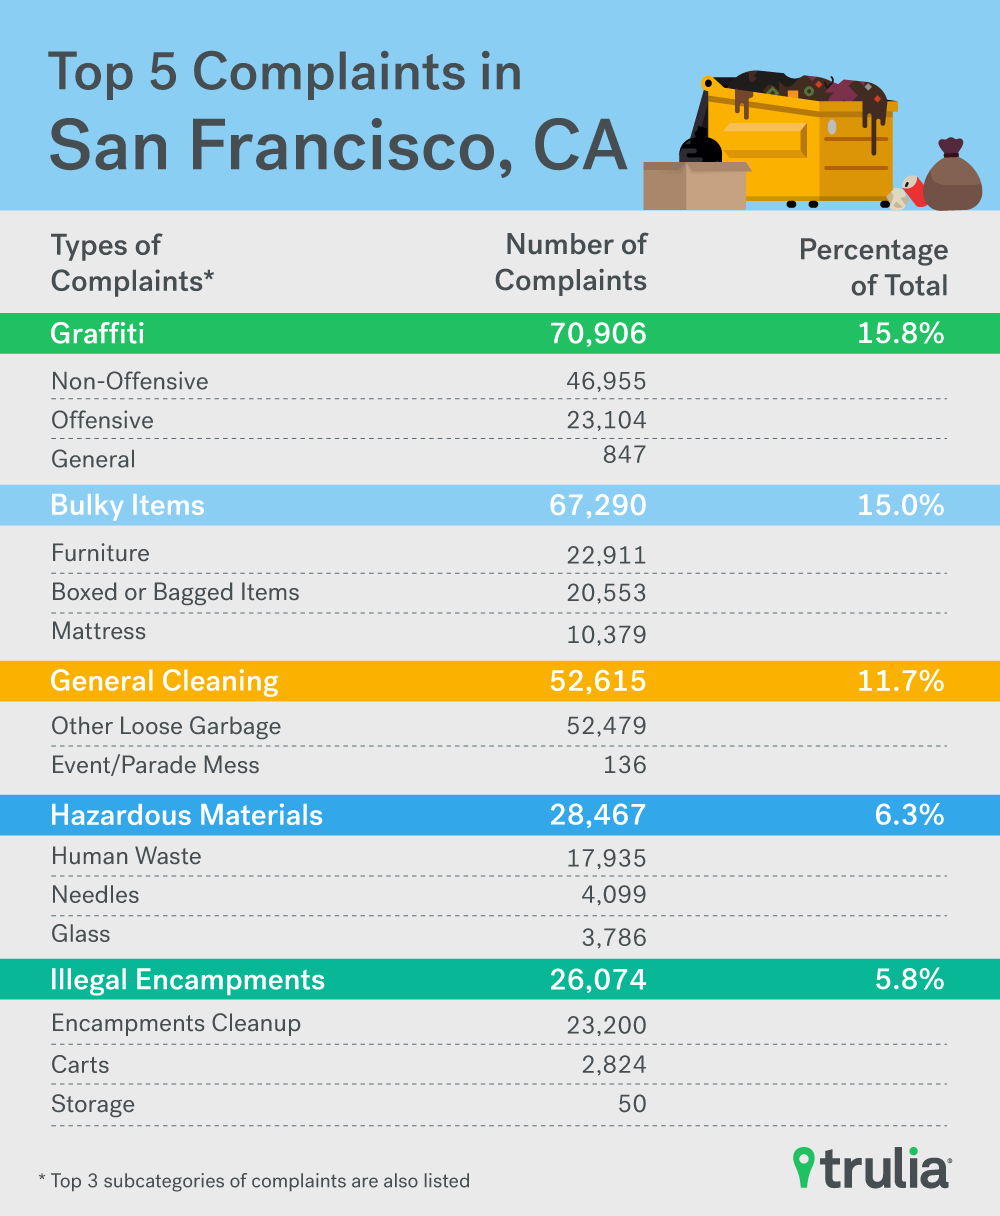
San Franciscans have sensitive eyes. They are more apt to be bothered by visual blight and are more likely to complain about graffiti, garbage and other visual nuisances.
Though each city logs its complaints differently, we were able to make a general comparison. We culled nearly a year’s worth of both cities’ 311 logs, the city-run information lines residents can, among other things, call to report nuisances.
Using that data, we’ve created maps for noise complaints in New York and reported eyesores in San Francisco. Each map is designed to provide both a bird’s eye view and a nuanced street view of 311 complaints over the last year — just change the zoom level or move around the map to adjust the view.
In New York:
- Loud music and parties make up more than half of the 311 reports for noise in New York City.
- The cacophony in Bedford-Stuyvesant and Harlem neighborhoods led to the highest number of reports to 311.
- In addition to noise, New Yorkers are more likely to complain when their building doesn’t have heat or hot water. They also get bent out of shape about blocked driveways and street conditions.
Keep It Down! Where New Yorkers Can’t Stand the Noise
Burr, It’s Cold: Where New Yorkers Complain About NOT Having Heat or Hot Water
Don’t Block Me! Where New Yorkers Complain About Blocked Driveways
Where New Yorkers Can’t Deal with Potholes, Caved-In or Cracked Roads
In San Francisco:
- Graffiti mars the private and public surfaces in San Francisco, prompting most of the reports to 311. Thankfully, residents report that most of it is non-offensive.
- The Mission, Chinatown and SoMa (South of Market) neighborhoods have the most graffiti complaints. The Mission had 10,675 complaints in 2016 – making up almost one out of every four complaints made in the city.
- San Franciscans also are concerned about cleanliness. In addition to graffiti on their walls, they also tend to alert the city when their streets become a dumping ground for furniture, human waste, needles and other hazardous materials.
- Homelessness is a problem in both New York and San Francisco, but the particular problem of illegal homeless encampments was among the top complaints in San Francisco: 5.8% of all complaints made by residents.
Where San Franciscans Don’t Appreciate Street Art (Graffiti)
Where San Franciscans Say NO to Dumping Furniture, Bags, Boxes or Mattresses
No Littering: Where San Franciscans Aren’t Fond of Loose Garbage
HazMat Alert: Where San Franciscans Can’t Stand Human Waste, Needles or Glass
No Squatting: Where San Franciscans Complain About Illegal Encampment
While many of the problems residents note in these complaints may seem to be part and parcel of city living, they do come at a time when living in New York or San Francisco is cost-prohibitive for many.
New York has the seventh highest median home price in the nation at $621,000 and 14th highest median rent at $2,322. San Francisco, of course, leads the nation with a median home price of $1.13 million and monthly median rents of $4,462, a 50.7% increase from five years ago.
Methodology
Data for this report comes from 311, which serves as a hotline for municipal non-emergency requests or complaints. These data are collected from public reports to the local 311 hotline, website form, or mobile application in New York City and San Francisco. Both New York City and San Francisco publish all 311 cases through their OpenData portals. 311 reports for New York City ranges from January 1, 2016 and December 16, 2016, and for San Francisco reports range from January 1, 2016 and December 18, 2016.
Data Aggregation
This report focuses on the top five categories of 311 cases for each city. For New York City, the main categories were drawn from “Complaint Type” and sub-categories were assigned from the “Descriptor.” For the San Francisco data, these categories were drawn from “Request Type” and sub-categories come from “Request Details.” To simplify the analysis, some categories were collapsed into one. San Francisco, for example, separates the Request Type for graffiti by whether it is found on public/private property and whether it is offensive or not, but we here lump these together. Sub-categories ensure that the broader complaints or requests do not mask the more granular types of grievances people report.
Note that neighborhoods identified in the analysis are based on Trulia’s proprietary neighborhood definitions.
Heat Maps
We plotted the raw, georeferenced data for the five most common types of complaints for each city. The more intense the color, the more frequently complaints occur in that area of the map. The heat maps animate over time and highlights areas where there are more complaints over others
A number of cases are reported without a specific location, in San Francisco 0.7% cases are missing actual locations and do not appear on the map but are counted in the larger discussion on the number of case types. In New York, 1.7% of cases in the top five categories are missing location data.

