SAN FRANCISCO, March 5, 2013 – Trulia (NYSE: TRLA) today released the latest findings from the Trulia Price Monitor and the Trulia Rent Monitor, the earliest leading indicators available of trends in home prices and rents. Based on the for-sale homes and rentals listed on Trulia, these monitors take into account changes in the mix of listed homes and reflect trends in prices and rents for similar homes in similar neighborhoods through February 28, 2013.
Asking Home Prices Up in 90 Out Of 100 Major Metros
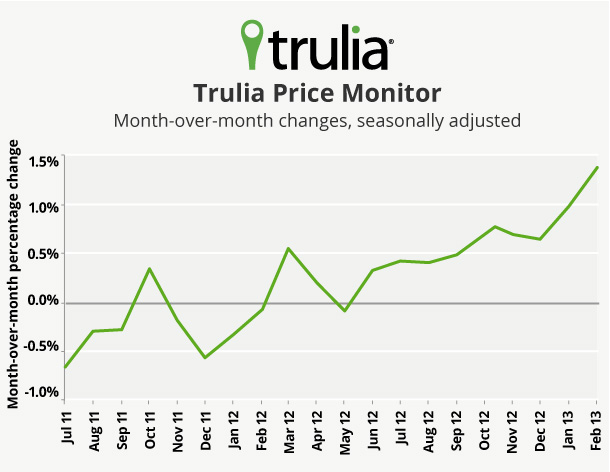
Since bottoming 12 months ago, national asking home prices rose 7.0 percent year-over-year (Y-o-Y) in February. Seasonally adjusted, asking prices also increased 1.4 percent month-over-month (M-o-M) and 3.0 percent quarter-over-quarter (Q-o-Q) – marking two post-recession highs. Asking prices locally are up in 90 of the 100 largest U.S. metros, rising fastest in Phoenix, Las Vegas, and Oakland.
|
February 2013 Trulia Price Monitor Summary |
|||
|
|
% change in asking prices |
# of 100 largest metros with asking-price increases |
% change in asking prices, excluding foreclosures |
|
Month-over-month, |
1.4% |
Not reported |
1.6% |
|
Quarter-over-quarter, |
3.0% |
92 |
3.5% |
|
Year-over-year |
7.0% |
90 |
7.4% |
Meanwhile, rent increases are slowing down. In February, rents rose just 3.2 percent Y-o-Y. This is a notable decrease from three months ago, in November, when rents were up 5.4 percent Y-o-Y. Among the 25 largest rental markets, rents rose the most in Houston, Oakland, and Miami, while falling slightly in San Francisco and Las Vegas. See here for the full list of price and rent changes in the largest metro areas.
Inventory Will Not Turn Around in 2013 Even Though Decline Is Slowing Down
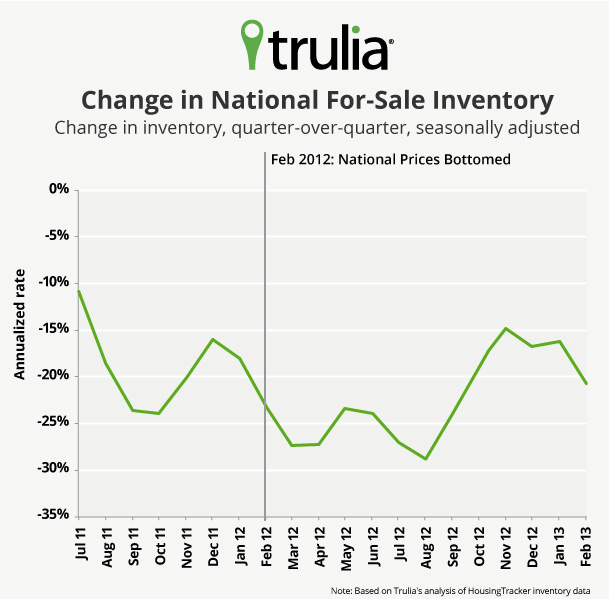
Inventory falls most sharply just after prices bottom, creating an “inventory spiral”: rising prices reduce inventory as would-be home sellers hold off in the hopes of selling later at a higher price, and falling inventory boosts prices further as buyers compete for a limited number of for-sale homes. Nationally, the annualized rate of inventory decline was 23 to 29 percent from March to September 2012, the months after home prices first bottomed one year ago, but has softened to a 14 to 21 percent rate since October [1] At the local level, metros still caught in the “inventory spiral” are where prices bottomed around one year ago and inventory is down sharply, such as in Sacramento, Riverside–San Bernardino, and Seattle.
Longer term, however, higher home prices add to inventory as more homeowners decide to sell and home builders increase construction activity. Metros where prices bottomed closer to 2 years ago, like Phoenix, Miami, and Detroit, are seeing milder inventory declines today, but still not increases.
|
U.S. Metro |
Y-o-Y % change in asking prices, Feb 2013 |
Months since asking prices bottomed |
Y-o-Y % change in inventory, Feb 2013[2] |
|
18.1% |
12 |
-68% |
|
|
14.9% |
13 |
-50% |
|
|
13.1% |
12 |
-38% |
|
|
13.7% |
21 |
-27% |
|
|
24.9% |
22 |
-12% |
|
|
14.0% |
25 |
-10% |
For the U.S. overall, an inventory turnaround in 2013 is unlikely. Since national asking home prices bottomed in February 2012, it may be at least another year before national inventory starts expanding. Inventory will make a turnaround first where asking prices bottomed earliest, such as in Phoenix, Miami, Detroit, Houston, and Oklahoma City. The inventory turnaround is a longer way off in metros where prices have bottomed more recently, such as in Sacramento and the Inland Empire.
PRE-APPROVED QUOTES
- “Housing inventory is scarce across the country and will probably be even tighter this time next year,” said Jed Kolko, Trulia’s Chief Economist. “However, inventory is declining more slowly now than it did a year ago, when prices bottomed. The inventory turnaround depends not only on how fast prices are rising today, but also whether prices have been rising long enough to encourage homeowners to sell and builders to build.”
- “As the spring home season begins, buyers face a dilemma between buying now, before prices rise even more, or later this year, when they’ll have more inventory to choose from,” said Jed Kolko, Trulia’s Chief Economist. “Inventory follows a strong seasonal pattern, peaking in the summertime, so buyers can look forward to more inventory in the coming months even though there will be less inventory this summer than last summer.”
MULTIMEDIA
- To read the full report, see here.
- To download a graph of price changes from July 2011 to February 2013, see here.
- To download a graph of inventory changes from July 2011 to February 2013, see here.
METHODOLOGY
To view the full methodology and 2013 release schedule, see here. The next release of the Trulia Price Monitor and the Trulia Rent Monitor will be Thursday, April 4, at 10 AM ET.
ABOUT TRULIA, INC.
Trulia (NYSE: TRLA) gives home buyers, sellers, owners, and renters the inside scoop on properties, places, and real estate professionals. Trulia has unique info on the areas people want to live that can’t be found anywhere else: users can learn about agents, neighborhoods, schools, crime, commute times, and even ask the local community questions. Real estate professionals use Trulia to connect with millions of transaction-ready buyers and sellers each month via our hyper local advertising services, social recommendations, and top-rated mobile real estate apps. Trulia is headquartered in downtown San Francisco. Trulia is a registered trademark of Trulia, Inc.

