SAN FRANCISCO, December 4, 2012 – Trulia today released the latest findings from the Trulia Price Monitor and the Trulia Rent Monitor, the earliest leading indicators available of trends in home prices and rents. Based on the for-sale homes and rentals listed on Trulia, these monitors take into account changes in the mix of listed homes and reflect trends in prices and rents for similar homes in similar neighborhoods through November 30, 2012.
Asking Prices Up 3.8 Percent Year-over-Year Nationally
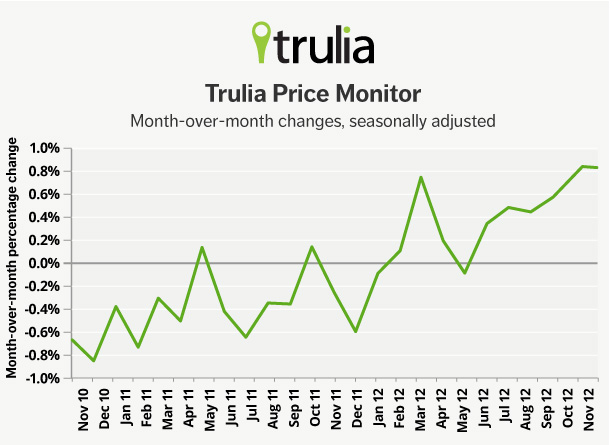
In November, asking home prices rose 0.8 percent month-over-month (M-o-M), seasonally adjusted–which implies an annualized growth rate of 10 percent. Year-over-year (Y-o-Y) prices increased 3.8 percent, which was also the largest yearly increase to date. Quarter-over-quarter (Q-o-Q) prices rose 2.2 percent, seasonally adjusted, another post-crisis high; in fact, prices rose 0.8 percent Q-o-Q without adjusting for seasonality (not shown in table), even though prices typically decline after the summer. Excluding foreclosures, asking prices rose 4.3 percent Y-o-Y and 1.6 percent Q-o-Q, seasonally adjusted.
|
November 2012 Trulia Price Monitor Summary |
|||
|
|
% change in asking prices |
# of 100 largest metros with asking-price increases |
% change in asking prices, excluding foreclosures |
|
Month-over-month, |
0.8% |
Not reported |
0.8% |
|
Quarter-over-quarter, |
2.2% |
70 |
1.6% |
|
Year-over-year |
3.8% |
76 |
4.3% |
Home Prices in Hard-Hit Atlanta, Sacramento, and the Inland Empire Now Bouncing Back
For the first time since the housing crisis began, Atlanta and two inland California metros—Riverside–San Bernardino and Sacramento—all experienced significantly large Q-o-Q asking home price gains. Unlike other hard-hit metros such as Phoenix, Las Vegas, and Miami, prices in these metros have been slower to bounce back, declining in February and making smaller gains in August and May. Other metros experiencing large quarterly increases in November include Salt Lake City and Wilmington, DE, both of which surpassed 7 percent, along with, Cape Coral – Fort Myers, FL, San Jose, Portland, OR, and Denver.
|
Metros with Largest Q-o-Q Asking Price Gains |
|||||
|
# |
U.S. Metro |
Q-o-Q % change in asking prices, Nov 2012 |
Q-o-Q % change in asking prices, Aug 2012 |
Q-o-Q % change in asking prices, May 2012 |
Q-o-Q % change in asking prices, Feb 2012 |
|
1 |
7.8% |
2.2% |
4.2% |
-4.1% |
|
|
2 |
Wilmington, DE-MD-NJ |
7.4% |
-1.9% |
-0.5% |
-1.3% |
|
3 |
6.8% |
5.2% |
6.5% |
6.0% |
|
|
4 |
6.2% |
0.0% |
1.7% |
-2.1% |
|
|
5 |
6.1% |
2.4% |
0.7% |
4.5% |
|
|
6 |
5.5% |
3.5% |
0.9% |
-1.3% |
|
|
7 |
5.3% |
2.1% |
1.3% |
-4.3% |
|
|
8 |
5.0% |
5.9% |
2.2% |
0.9% |
|
|
9 |
Portland, OR-WA |
4.8% |
0.3% |
2.1% |
-0.6% |
|
10 |
4.7% |
2.9% |
1.9% |
2.2% |
|
Among the 100 largest metro areas.
Rents Rose 5.6 Percent Year-over-Year, But Prices Catching Up in Largest Markets
Nationally, rents rose 5.6 percent Y-o-Y, outpacing the national price gain of 3.8 percent. However, asking prices in 14 of the 25 largest rental markets actually rose faster than rents as the price recovery picks up. In fact, prices have zoomed ahead of fast-rising rents in Denver, Seattle, and San Francisco, which rank among the top 10 metros where rents rose most in November.
|
Metros with Largest Y-o-Y Rent Increases |
|||
|
# |
U.S. Metro |
% change in rents, Y-o-Y , Nov 2012 |
% change in asking prices, Y-o-Y ,Nov 2012 |
|
1 |
16.8% |
2.3% |
|
|
2 |
11.6% |
10.5% |
|
|
3 |
10.8% |
7.6% |
|
|
4 |
9.0% |
12.4% |
|
|
5 |
8.9% |
-0.8% |
|
|
6 |
8.3% |
8.8% |
|
|
7 |
Minneapolis–St. Paul, MN-WI |
7.8% |
7.1% |
|
8 |
6.9% |
-3.1% |
|
|
9 |
New York, NY-NJ |
6.6% |
0.3% |
|
10 |
5.8% |
9.5% |
|
Among the 25 largest rental markets.
PRE-APPROVED QUOTES
- “Prices are rising faster than at any point since the bubble burst, but the price recovery is becoming more uneven,” said Jed Kolko, Trulia’s Chief Economist. “Even though prices rose at a 10 percent annualized rate in the last quarter, more metros are seeing price declines. The price recovery is strongest in the largest metros, and price gains have now surpassed rent gains in the largest 25 rental markets. However, price gains are starting to waver in smaller markets.”
- “The key factors behind today’s price gains are job growth, falling vacancies, and–above all–rebounding from the huge price declines of the housing bust,” said Jed Kolko, Trulia’s Chief Economist. “The latest metros to join the price rebound are Atlanta, Sacramento, and Riverside-San Bernardino. Now, all of the metros that suffered most during the bust have had year-over-year price gains.”
MULTIMEDIA
- To read the full report, see here.
- To download the full list of price and rent changes for the largest metro areas, see here.
- To download a graph of price changes from November 2010 to November 2012, see here.
METHODOLOGY
To view the full methodology and 2013 release schedule, see here. The next release of the Trulia Price Monitor and the Trulia Rent Monitor will be Thursday, January 3, at 10 AM ET.
ABOUT TRULIA, INC.
Trulia (NYSE: TRLA) gives home buyers, sellers, owners, and renters the inside scoop on properties, places, and real estate professionals. Trulia has unique info on the areas people want to live that can’t be found anywhere else: users can learn about agents, neighborhoods, schools, crime, commute times, and even ask the local community questions. Real estate professionals use Trulia to connect with millions of transaction-ready buyers and sellers each month via our hyper local advertising services, social recommendations, and top-rated mobile real estate apps. Trulia is headquartered in downtown San Francisco. Trulia is a registered trademark of Trulia, Inc.

