


Home Value
Trulia Estimate
$514KSince last month
Decreased$5K (-0.9%)Since last year
Increased$11K (+2.1%)Since last sale
Increased$385K (+296.5%)Learn more about this home's value by checking out its Trulia Estimate, the value of nearby homes, and how much similar homes have sold for.
Trulia Estimate
The of this home's value increased by +105% in the last 10 years
| Month | Estimated value |
|---|---|
2026 | |
| October 2026 | $515K |
| September 2026 | $520K |
| August 2026 | $523K |
| July 2026 | $524K |
| June 2026 | $518K |
| May 2026 | $513K |
| April 2026 | $510K |
| March 2026 | $503K |
| February 2026 | $498K |
| January 2026 | $493K |
2025 | |
2024 | |
2023 | |
2022 | |
2021 | |
2020 | |
2019 | |
2018 | |
2017 | |
2016 | |
Comparable sales
These are recently sold homes that have a similar location or other similar features to this home, like bedrooms, bathrooms, and square footage. Get a sense of the expected prices in the area by viewing these homes.Address | Distance | Property Type | Sold Price | Sold Date | Bed | Bath | Sqft |
|---|---|---|---|---|---|---|---|
0.14 | Single-Family Home | - | 06/18/26 | 3 | 2 | 1,716 | |
0.19 | Single-Family Home | - | 03/12/26 | 5 | 3 | 2,340 | |
0.19 | Single-Family Home | - | 02/09/26 | 3 | 2 | 2,520 | |
0.29 | Single-Family Home | - | 05/01/26 | 3 | 2.5 | 2,100 | |
0.20 | Single-Family Home | - | 04/30/26 | 4 | 3 | 2,967 | |
0.69 | Single-Family Home | - | 05/29/26 | 3 | 2 | 1,023 | |
0.78 | Single-Family Home | - | 01/07/26 | 3 | 2 | 1,248 | |
0.76 | Single-Family Home | - | 12/12/25 | 4 | 2 | 987 | |
0.79 | Single-Family Home | - | 03/23/26 | 4 | 2.5 | 2,262 | |
0.71 | Single-Family Home | - | 03/16/26 | 4 | 3 | 2,372 |
Nearby home prices
Get a sense of expected prices in the area by checking the value of nearby homes.Address | Distance | Price | Bed | Bath | Sqft | Status |
|---|---|---|---|---|---|---|
0.01 | $503,800 | 4 | 2 | 1,062 | Off Market | |
0.01 | $519,700 | 3 | 2 | 1,350 | Off Market | |
0.03 | $470,000 | 3 | 2 | 1,066 | Off Market | |
0.03 | $612,500 | 6 | 3 | 2,743 | Off Market | |
0.03 | $466,500 | 3 | 1 | 1,116 | Off Market | |
0.04 | $564,500 | 5 | 3 | 2,360 | Off Market | |
0.04 | $476,300 | 3 | 2 | 1,170 | Off Market | |
0.04 | $523,900 | 4 | 2.5 | 2,100 | Off Market | |
0.04 | $494,400 | 2 | 1 | 1,455 | Off Market | |
0.04 | $525,900 | 5 | 2 | 1,221 | Off Market | |
0.05 | $573,000 | 4 | 2 | 1,684 | Off Market | |
0.05 | $552,500 | 4 | 3 | 1,032 | Off Market | |
0.05 | $592,200 | 5 | 3 | 1,220 | Off Market | |
0.05 | - | - | - | - | Off Market | |
0.05 | $541,600 | 5 | 2 | 1,950 | Off Market | |
0.05 | $576,900 | 5 | 3 | 1,050 | Off Market | |
0.05 | $487,800 | 4 | 2 | 975 | Off Market | |
0.06 | $511,900 | 3 | 3 | 1,180 | Off Market | |
0.06 | $550,500 | 4 | 2 | 2,430 | Off Market | |
0.06 | $588,600 | 3 | 1 | 1,487 | Off Market |
Local Information
- Map ViewExplore the area around 6953 S 160 E.

- Schools1 Elementary School2 Middle Schools1 High School

- Shop & Eat

-- mins to
Home Highlights

Single-Family Home

Built in 1963

1,612 sqft

$319/sqft
About this House
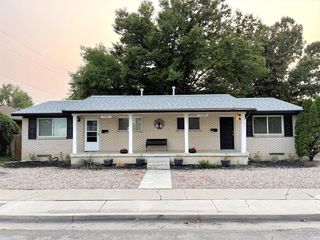
Stunning East Midvale remodel. New carpet, paint, flooring, updated kitchen, new appliance, new landscape. Close to schools, shopping, and easy freeway access. Great central location. Great views, great neighborhood.
6953 S 160 E, Midvale, UT 84047 is a 4 bedroom, 2 bathroom, 1,612 sqft single-family home built in 1963. It was last sold on Jun 18, 2013. This property is not currently displayed as for sale or rent on Trulia. The Trulia Estimate is $513,800, with a rent estimate of $2,428/month.
Home Details for 6953 S 160 E

|
|---|
Interior Details BasementNumber of Rooms: 9Types of Rooms: Family Room |
Heating & Cooling Heating: GasAir ConditioningCooling System: CentralHeating Fuel: Gas |
Levels, Entrance, & Accessibility Stories: 1Floors: Tile, Carpet, Laminate |

|
|---|
Exterior Home Features Roof: OtherExterior: Brick |
Parking & Garage Parking Space: 1Parking: Carport |

|
|---|
Year Built Year Built: 1963Year Updated: 1998 |
Property Type / Style Property Type: Single Family HomeArchitecture: Other |

|
|---|
Units in Building: 1 |

|
|---|
Lot Area: 7840 sqft |
Price and Tax history
| Date | Event | Price |
|---|---|---|
Jun 18, 2013 Source: N/A | Sold | -- |
May 10, 2013 Source: Agent Provided | Listed For Sale | $184,500 |
Mar 18, 2012 Source: Agent Provided | ListingRemoved | $152,000 |
Feb 25, 2011 Source: Agent Provided | PriceChange | $152,000 Price increased by 5% |
Feb 18, 2011 Source: Agent Provided | PriceChange | $145,000 Price decreased by 5% |
Dec 11, 2010 Source: Agent Provided | PriceChange | $152,000 Price increased by 5% |
Dec 4, 2010 Source: Agent Provided | PriceChange | $145,000 Price decreased by 5% |
Dec 1, 2010 Source: Agent Provided | PriceChange | $152,000 Price increased by 5% |
Nov 19, 2010 Source: Agent Provided | Listed For Sale | $145,000 |
Nov 16, 2010 Source: N/A | Sold | -- |
Nov 10, 2010 Source: Agent Provided | PriceChange | $152,000 Price increased by 5% |
Aug 28, 2010 Source: Agent Provided | PriceChange | $145,000 Price decreased by 5% |
Jul 26, 2010 Source: Agent Provided | Listed For Sale | $152,000 |
Jul 13, 2010 Source: N/A | Sold | -- |
Oct 3, 2009 Source: Agent Provided | ListingRemoved | $198,000 |
Apr 11, 2009 Source: Agent Provided | Listed For Sale | $198,000 |
| Year | Property tax | Tax assessment |
|---|---|---|
| 2025 | $3,209 | $509,500 |
Home facts updated by county records
Market trends in Midvale
Last updated September 2026
Avg. sale price
—
Sale-to-List Price
—
Price per sq ft
—
Available listings
140
13MoM
Sourced by Trulia Market Trends
Around this home
What Locals Say about Midvale
This October
Trick-or-Treat Score
Built from what locals say about this neighborhood.- 89% say there are sidewalks
- 68% say there's holiday spirit
- 40% say neighbors are friendly
Trulia Trick or TreatStart Ghost Hunt
At least 197 Trulia users voted on each feature.

89 % Say there are sidewalks

86 % Say it's dog friendly

81 % Say parking is easy

80 % Say car is needed

68 % Say there's holiday spirit

66 % Say kids play outside

62 % Say it's walkable to restaurants

62 % Say yards are well-kept

59 % Say streets are well-lit

58 % Say it's walkable to grocery stores

55 % Say it's quiet

54 % Say people would walk alone at night

40 % Say neighbors are friendly

31 % Say they plan to stay for at least 5 years

27 % Say there are community events

18 % Say there's wildlife
Sourced by Trulia users. Learn more about our methodology.
LGBTQ Local Legal Protections
LGBTQ Local Legal Protections


Frequently asked questions about 6953 S 160 E
- What is 6953 S 160 E estimated to be worth?Trulia's estimated value for 6953 S 160 E in Midvale, UT is $513,800.
- What is the price history for 6953 S 160 E?6953 S 160 E in Midvale, UT last sold in June 2013.
- Is Midvale a buyer's or seller's market?Midvale is currently a buyer's market, based on recent for-sale activity.
- What do residents say about Midvale?Residents describe Midvale, UT as pedestrian-friendly, dog-friendly, and easy to park in. See recently sold homes in Midvale, UT.
- Does 6953 S 160 E have air conditioning?Yes, 6953 S 160 E in Midvale, UT has air conditioning.
- How big is the lot at 6953 S 160 E?The lot at 6953 S 160 E in Midvale, UT is about 0.18 acres (7,840 sq ft).
Explore by feature - Pet Friendly
 SPECIAL OFFERPET FRIENDLY
 SPECIAL OFFERPET FRIENDLY
 SPECIAL OFFERPET FRIENDLY
 PET FRIENDLY$1,169 - $2,005/mo
 Studio-3 bd
 1-2 baSprings of Country Woods | 6945 S Well Wood Rd,
Midvale, UT 84047 PET FRIENDLY
 SPECIAL OFFERPET FRIENDLY
 PET FRIENDLYINCOME RESTRICTED
 SPECIAL OFFERPET FRIENDLY
 SPECIAL OFFERPET FRIENDLY
 SPECIAL OFFERPET FRIENDLY
Explore by feature - Garage
- SPECIAL OFFERPET FRIENDLY
- PET FRIENDLY$1,169 - $2,005/moStudio-3 bd1-2 baSprings of Country Woods | 6945 S Well Wood Rd,
Midvale, UT 84047 - SPECIAL OFFERPET FRIENDLY
 SPECIAL OFFERPET FRIENDLY
 SPECIAL OFFERPET FRIENDLYINCOME RESTRICTED
 SPECIAL OFFER

 PET FRIENDLY
 PET FRIENDLYINCOME RESTRICTED
 APPLY INSTANTLYPET FRIENDLYFURNISHED
Explore by feature - Air Conditioning
- SPECIAL OFFERPET FRIENDLY
- SPECIAL OFFERPET FRIENDLY
- SPECIAL OFFERPET FRIENDLY
- PET FRIENDLY$1,169 - $2,005/moStudio-3 bd1-2 baSprings of Country Woods | 6945 S Well Wood Rd,
Midvale, UT 84047 - PET FRIENDLY
- SPECIAL OFFERPET FRIENDLY
- PET FRIENDLYINCOME RESTRICTED
- SPECIAL OFFERPET FRIENDLY
- SPECIAL OFFERPET FRIENDLY
- SPECIAL OFFERPET FRIENDLY
Explore by feature - Pool
- NEW - 1 HR AGOSPECIAL OFFERPET FRIENDLY
- NEW - 9 HRS AGOSPECIAL OFFERPET FRIENDLYINCOME RESTRICTED
- NEW - 15 HRS AGOSPECIAL OFFERPET FRIENDLY
 NEW - 17 HRS AGOAPPLY INSTANTLYPET FRIENDLY
 NEW - 19 HRS AGOSPECIAL OFFERPET FRIENDLY
 SPECIAL OFFERPET FRIENDLY
- SPECIAL OFFERPET FRIENDLY
 SPECIAL OFFERPET FRIENDLY
- SPECIAL OFFERPET FRIENDLY
- PET FRIENDLY
Explore by feature - Washer/dryer
- SPECIAL OFFERPET FRIENDLY
- SPECIAL OFFERPET FRIENDLY
- SPECIAL OFFERPET FRIENDLY
- PET FRIENDLY$1,169 - $2,005/moStudio-3 bd1-2 baSprings of Country Woods | 6945 S Well Wood Rd,
Midvale, UT 84047 - PET FRIENDLY
- SPECIAL OFFERPET FRIENDLY
- PET FRIENDLYINCOME RESTRICTED
- SPECIAL OFFERPET FRIENDLY
- SPECIAL OFFERPET FRIENDLY
 SPECIAL OFFERPET FRIENDLY
Explore by feature - Outdoor Space
 FURNISHED
 PET FRIENDLY
 PET FRIENDLY
 APPLY INSTANTLYPET FRIENDLYFURNISHED
 APPLY INSTANTLY
 APPLY INSTANTLY
 APPLY INSTANTLYPET FRIENDLY
 APPLY INSTANTLYPET FRIENDLY
 APPLY INSTANTLYPET FRIENDLY

Apartments for Rent
- PET FRIENDLY
 PET FRIENDLYTotal price$1,164 - $2,014/moStudio-2 bd1-2 baThe Focal Apartments | 447 W 4800 S,
Salt Lake City, UT 84123 PET FRIENDLY
 PET FRIENDLY
- PET FRIENDLY
- PET FRIENDLY
- PET FRIENDLY
- PET FRIENDLY
 PET FRIENDLY$1,104 - $2,070/moStudio-2 bd1-2 baCurrent Apartments | 4994 S Commerce Dr,
Salt Lake City, UT 84107- PET FRIENDLY$1,169 - $2,005/moStudio-3 bd1-2 baSprings of Country Woods | 6945 S Well Wood Rd,
Midvale, UT 84047  PET FRIENDLY
 PET FRIENDLYTotal price$1,650 - $3,229/mo1-2 bd1-2 baElara at Holladay Crossing | 6121 S Highland Dr,
Salt Lake City, UT 84121 PET FRIENDLY
 SENIOR HOUSINGPET FRIENDLY
 PET FRIENDLYINCOME RESTRICTED
 See more homes for rent inMidvale
Off Market Homes Near 6953 S 160 E
 SOLDOCT 13, 2026
- SOLDOCT 9, 2026
 SOLDOCT 9, 2026
- SOLDOCT 7, 2026
- SOLDOCT 6, 2026
 SOLDOCT 6, 2026
- SOLDOCT 6, 2026
- SOLDSEP 30, 2026
 SOLDSEP 30, 2026
- SOLDSEP 28, 2026
 See more homes for sale inMidvale
Homes for sale near 6953 S 160 E
 0.25 ACRESConrad Cruz Real Estate Services, LLC
 Coldwell Banker Realty (Salt Lake-Sugar House)
- See more homes for sale inMidvale


- Results are loading