


45 Capron St
Providence, RI 02909
Olneyville 7 Beds
 3 Baths
 850 sqft
7 Beds
3 Baths
850 sqft
Local Information
- Map ViewExplore the area around 45 Capron St.

- Schools8 Preschool Schools19 Elementary Schools5 Middle Schools6 High Schools

- Shop & Eat

-- mins to
Description
Incredible Three-Family Opportunity "Seller Financing" ââ¬â Seven (7) Bedrooms (Townhouse Style) with many upgrades and improvements. Nestled on a quiet street, close to shopping, neighborhood parks, easy Highway access and close to Federal Hill. Open style garage (2 cars) with abundant parking & paved driveway - Call for your showing today
45 Capron St, Providence, RI 02909 is a 7 bedroom, 3 bathroom, 850 sqft single-family home in Olneyville, built in 1900. It last sold for $400,000 on Feb 28, 2022. More recently, it was listed as a rental in November 2012 with an asking price of $850 per month. That rental listing was removed on March 14, 2013. It is currently off market. The Trulia Estimate is $546,900, with a rent estimate of $2,838/month.
Home Highlights
Parking
Garage
Outdoor
No Info
A/C
Heating only
HOA
None
Price/Sqft
No Info
Listed
Less than a day ago
Home Details for 45 Capron St
|
|---|
Heating & Cooling Heating: Baseboard, GasHeating Fuel: Baseboard |
Levels, Entrance, & Accessibility Stories: 2Floors: Other |
Interior Details Number of Rooms: 14 |
Appliances & Utilities Refrigerator |
|
|---|
Exterior Home Features Roof: AsphaltExterior: Other |
Parking & Garage GarageParking Spaces: 8Parking: Garage Detached |
|
|---|
Year Built Year Built: 1900 |
Property Type / Style Property Type: Single Family HomeArchitecture: Other |
|
|---|
Units in Building: 3 |
|
|---|
Lot Area: 3920 sqft |
Price History for 45 Capron St
| Date | Price | Event | Source |
|---|---|---|---|
| 02/28/2022 | $400,000 | Sold | StateWide MLS RI #1300801 |
| 01/31/2022 | $399,900 | Pending | StateWide MLS RI #1300801 |
| 01/21/2022 | $399,900 | PriceChange | StateWide MLS RI #1300801 |
| 01/12/2022 | $425,000 | Pending | StateWide MLS RI #1300801 |
| 01/02/2022 | $425,000 | Listed For Sale | StateWide MLS RI #1300801 |
| 12/09/2020 | $340,000 | Sold | StateWide MLS RI #1264640 |
| 10/05/2020 | $349,000 | Pending | Agent Provided |
| 10/01/2020 | $349,000 | PriceChange | Agent Provided |
| 09/18/2020 | $375,000 | Listed For Sale | Agent Provided |
| 03/14/2013 | $850 | ListingRemoved | Agent Provided |
| 11/07/2012 | $850 | Listed For Rent | Agent Provided |
| 02/18/2011 | $800 | ListingRemoved | Agent Provided |
| 01/20/2011 | $800 | Listed For Rent | Agent Provided |
| 08/07/2009 | $73,500 | Sold | N/A |
| 10/02/2008 | $102,425 | Sold | N/A |
| 06/10/2008 | $139,000 | PriceChange | Agent Provided |
| 05/25/2008 | $159,000 | PriceChange | Agent Provided |
| 04/22/2008 | $199,000 | Listed For Sale | Agent Provided |
| 08/30/2005 | $270,000 | Sold | N/A |
| 05/27/1999 | $34,000 | Sold | N/A |
Market trends in Providence
Last updated May 2026
Avg. sale price
$409K
$2.67KMoM
Sale-to-List Price
99.4%
Price per sq ft
$319
$11MoM
Available listings
233
18MoM

- Results are loading
Property Tax and Assessment
| Year | 2025 |
|---|---|
| Tax | $3,653 |
| Assessment | $483,800 |
Home facts updated by county records
Comparable Sales for 45 Capron St
Address | Distance | Property Type | Sold Price | Sold Date | Bed | Bath | Sqft |
|---|---|---|---|---|---|---|---|
0.07 | Single-Family Home | $385,000 | 05/05/26 | 2 | 1 | 900 | |
0.03 | Single-Family Home | $440,000 | 12/23/25 | 4 | 2 | 1,994 | |
0.46 | Single-Family Home | $390,000 | 12/17/25 | 4 | 2 | 1,284 | |
0.38 | Single-Family Home | $350,000 | 02/25/26 | 3 | 2.5 | 2,096 | |
0.79 | Single-Family Home | $303,260 | 10/03/25 | 5 | 3 | 1,242 | |
0.45 | Single-Family Home | $341,000 | 02/27/26 | 3 | 2 | 1,560 | |
0.66 | Single-Family Home | $415,000 | 10/24/25 | 5 | 2 | 1,694 | |
0.62 | Single-Family Home | $312,000 | 07/30/25 | 4 | 2 | 1,300 | |
0.62 | Single-Family Home | $425,000 | 04/23/26 | 3 | 2.5 | 2,318 | |
0.59 | Single-Family Home | $450,000 | 05/07/26 | 5 | 2 | 2,220 |
Nearby homes
Get a sense of prices in the area by checking nearby homes. SOLDMAY 20, 2026Keller Williams Leading Edge
 OFF MARKETBroadway Real Estate Group


Assigned Schools
These are the assigned schools for 45 Capron St.
- William D'abate Elementary School
- K-5
- Public
- 405 Students
4/10GreatSchools RatingParent Rating AverageMy kids love their school, the teachers are phenomenal and staff…Parent Review2y ago - Dr. Jorge Alvarez High School
- 9-12
- Public
- 515 Students
1/10GreatSchools RatingParent Rating Average No reviews available for this school.
 - Esek Hopkins Middle School
- 6-8
- Public
- 459 Students
2/10GreatSchools RatingParent Rating AverageMy son went to this school in the 2018/2019 school year. i was invited to get a tour of the building before summer ending. when i walked into the building and the first thing i saw was a rat eating the school pizza.Parent Review2y ago - Veazie Street School
- PK-5
- Public
- 555 Students
3/10GreatSchools RatingParent Rating AverageNo reviews available for this school. - Robert L Bailey IV, Elementary School
- K-5
- Public
- 515 Students
6/10GreatSchools RatingParent Rating AverageNo reviews available for this school. - Alfred Lima Sr. Elementary School
- K-5
- Public
- 720 Students
2/10GreatSchools RatingParent Rating AverageNo reviews available for this school. - Charlotte Woods Elementary School
- PK-5
- Public
- 773 Students
3/10GreatSchools RatingParent Rating AverageNo reviews available for this school. - Anthony Carnevale Elementary School
- PK-5
- Public
- 601 Students
3/10GreatSchools RatingParent Rating AverageNo reviews available for this school. - Governor Christopher Delsesto Middle School
- 6-8
- Public
- 924 Students
2/10GreatSchools RatingParent Rating AverageNo reviews available for this school. - Juanita Sanchez Educational Complex
- 9-12
- Public
- 793 Students
3/10GreatSchools RatingParent Rating AverageNo reviews available for this school. - Asa Messer Elementary School
- PK-4
- Public
- 688 Students
4/10GreatSchools RatingParent Rating AverageNo reviews available for this school. - Harry Kizirian Elementary School
- PK-5
- Public
- 539 Students
4/10GreatSchools RatingParent Rating AverageThis school year for my son hasn't been the greatest, to start with his teacher was mostly absent and he was already getting tired of having substituted or ending with another class in a different grade, sometimes with first graters. now his teacher is not coming back there is a substitute teacher that we hope she can stay until the end of the school year.Parent Review3y ago - Central High School
- 9-12
- Public
- 1231 Students
3/10GreatSchools RatingParent Rating AverageNo reviews available for this school. - Classical High School
- 9-12
- Public
- 1121 Students
10/10GreatSchools RatingParent Rating AverageFrom my experience as a parent of a student, teachers are rude and far from understanding. Especially the principals. There was an incident where a teacher was misbehaving towards an autistic student, reported to the principals and nothing changed. Seen a review where another parent, just as i, stated where this school is a sink or swim. I truly agree. If you care for your child, do not support or engage in any way with this school. The principals are very rude, blamed my child for their kindness (not figuratively either, literally stated that). The only nice people within this school is the guidance counselor’s, which do not have enough power to do what they want to do but lag behind the principals who limit them.Parent Review3mo ago - Vartan Gregorian Elementary School
- K-5
- Public
- 351 Students
7/10GreatSchools RatingParent Rating AverageThis is the worst elementary school in Providence. If you’re a black or brown parent with black/brown children keep your child away from there. As a parent you have no voice and no respect. As a student, its even worst. My child was there Nd i have spoken to several parents and they have similar experience. My child was there and over a simple situation the principal said if you’re not happy you can take your kid out. Teachers have no respect for you and even the brown teachers have been brain washed. Long time ago blacks and brown students were accepted and respected but now they don't want them there. If you research you will find out. They were all rude from the top to the bottom.Parent Review1y ago - George J. West Elementary School
- K-5
- Public
- 563 Students
6/10GreatSchools RatingParent Rating AverageNo reviews available for this school. - Frank D. Spaziano Elementary School
- PK-5
- Public
- 656 Students
4/10GreatSchools RatingParent Rating Averagei love this school I went to here sadly on my 4th grade year I left the school for problems with the school principal but I’ll never forgot the memories I had here thank you for all of your hard work if I can reexperience this I would I will do anything to relive all of it again thanks you -Iker moralesOther Review6mo ago - Martin Luther King Elementary School
- PK-5
- Public
- 529 Students
6/10GreatSchools RatingParent Rating AverageNo reviews available for this school. - Mary E. Fogarty Elementary School
- K-5
- Public
- 488 Students
4/10GreatSchools RatingParent Rating AverageNo reviews available for this school. - Mount Pleasant High School
- 9-12
- Public
- 1075 Students
2/10GreatSchools RatingParent Rating AverageNo reviews available for this school. - Nathanael Greene Middle School
- 6-8
- Public
- 940 Students
5/10GreatSchools RatingParent Rating AverageThis school absolutely sucks. As a current student, there is no support for kids who have bad mental health. Mental health isn't really a priority in this school though they say it is. The teachers are okay though some have no respect for the students and are unfair to some students based off race. Some teachers even yell at students are don't take in the fact that there are students that don't speak English. Some teachers punish students that don't know English for using their phones when they need it to translate. The teachers can be overall very disrespectful. Family members are not as welcomed and the Health teacher is very ignorant and rude. There is absolutely no protection and or safety in this school. A ton of fights happen and lockdowns happen a lot, along with fire drills. There is no such thing as safety in this school. I don't recommend this school, find a different school instead of this one.Student Review7mo ago - Pleasant View School
- PK-5
- Public
- 497 Students
5/10GreatSchools RatingParent Rating AverageNo reviews available for this school. - Leviton Dual Language School
- K-5
- Public
- 327 Students
7/10GreatSchools RatingParent Rating AverageNo reviews available for this school. - Reservoir Avenue School
- K-5
- Public
- 324 Students
6/10GreatSchools RatingParent Rating AverageMi niña ama su escuela con solo elPrimer año de su escuela en kinder aprendió muchísimo su profesora es un amor y todos tú sientes esa seguridad desde que dejas tu hija en la puerta de la escuela la señora muy amable , le daría 1000000 estrellasParent Review10mo ago - Robert F. Kennedy Elementary School
- K-5
- Public
- 499 Students
7/10GreatSchools RatingParent Rating AverageNo reviews available for this school. - Roger Williams Middle School
- 6-8
- Public
- 895 Students
2/10GreatSchools RatingParent Rating AverageNo reviews available for this school. - Lillian Feinstein Elementary School
- K-5
- Public
- 491 Students
6/10GreatSchools RatingParent Rating AverageNo reviews available for this school. - Webster Avenue School
- K-5
- Public
- 346 Students
2/10GreatSchools RatingParent Rating AverageNo reviews available for this school. - Nathan Bishop Middle School
- 6-8
- Public
- 807 Students
5/10GreatSchools RatingParent Rating Averagebad school and mean teachers don't come plsStudent Review7mo ago - Hope High School
- 9-12
- Public
- 935 Students
1/10GreatSchools RatingParent Rating AverageGood school, they care about you and give u a good educationOther Review2y ago  Check out schools near 45 Capron St.
Neighborhood Overview
Neighborhood stats provided by third party data sources.
What Locals Say about Olneyville
At least 87 Trulia users voted on each feature.

83 % Say there are sidewalks

74 % Say it's walkable to restaurants

72 % Say it's dog friendly

71 % Say it's walkable to grocery stores

68 % Say kids play outside

62 % Say streets are well-lit

62 % Say car is needed

57 % Say parking is easy

53 % Say yards are well-kept

48 % Say there's holiday spirit

41 % Say neighbors are friendly

40 % Say people would walk alone at night

40 % Say there's wildlife

38 % Say they plan to stay for at least 5 years

33 % Say it's quiet

26 % Say there are community events
Sourced by Trulia users. Learn more about our methodology.
LGBTQ Local Legal Protections
LGBTQ Local Legal Protections

Apartments for Rent
 NEW - 1 DAY AGOPET FRIENDLY
 PET FRIENDLY$1,900 - $4,325/moStudio-2 bd1-2 baHalstead Providence | 255 Promenade St #P417,
Providence, RI 02908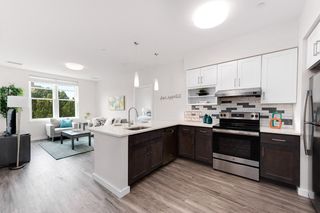 PET FRIENDLYTotal price$2,116 - $3,708/moStudio-3 bd1-2 baStation Row Apartments | 10 Park Row #633,
Providence, RI 02903 APPLY INSTANTLYPET FRIENDLY
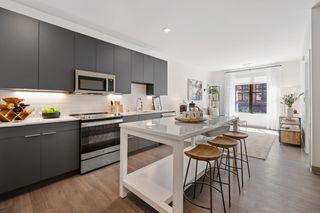 PET FRIENDLY
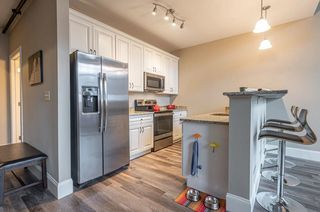 PET FRIENDLY
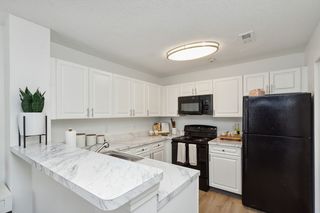 NEW - 7 HRS AGOPET FRIENDLY
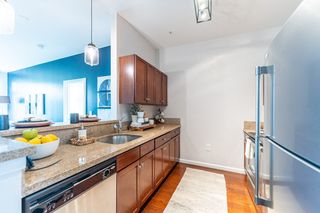 PET FRIENDLY
 PET FRIENDLY
 APPLY INSTANTLYPET FRIENDLY
 FURNISHED
 PET FRIENDLY
 NEW - 4 HRS AGOPET FRIENDLY
 APPLY INSTANTLYPET FRIENDLY
 PET FRIENDLY$1,745 - $2,195/mo1-2 bd1-2 baLofts and Townhomes at International | 528 Smithfield Rd #2B-1Ba-1100Sqft,
Providence, RI 02904 See more homes for rent inProvidence
Explore by feature - Pet Friendly
- NEW - 1 DAY AGOSPECIAL OFFERPET FRIENDLY
- SPECIAL OFFERPET FRIENDLY
- SPECIAL OFFERPET FRIENDLY
- PET FRIENDLY$1,900 - $4,325/moStudio-2 bd1-2 baHalstead Providence | 255 Promenade St #P417,
Providence, RI 02908 - PET FRIENDLY
- APPLY INSTANTLYPET FRIENDLY
- APPLY INSTANTLYPET FRIENDLY
- PET FRIENDLY
- PET FRIENDLYTotal price$2,116 - $3,708/moStudio-3 bd1-2 baStation Row Apartments | 10 Park Row #633,
Providence, RI 02903 - PET FRIENDLY
Explore by feature - Garage
- NEW - 1 DAY AGOSPECIAL OFFERPET FRIENDLY
- SPECIAL OFFERPET FRIENDLY
- SPECIAL OFFERPET FRIENDLY
- PET FRIENDLY$1,900 - $4,325/moStudio-2 bd1-2 baHalstead Providence | 255 Promenade St #P417,
Providence, RI 02908 - PET FRIENDLY
- PET FRIENDLYTotal price$2,116 - $3,708/moStudio-3 bd1-2 baStation Row Apartments | 10 Park Row #633,
Providence, RI 02903 - PET FRIENDLY
 PET FRIENDLY
 PET FRIENDLYFURNISHED
 NEW - 1 DAY AGOPET FRIENDLY
Explore by feature - Air Conditioning
- NEW - 1 DAY AGOSPECIAL OFFERPET FRIENDLY
- SPECIAL OFFERPET FRIENDLY
- SPECIAL OFFERPET FRIENDLY
- PET FRIENDLY$1,900 - $4,325/moStudio-2 bd1-2 baHalstead Providence | 255 Promenade St #P417,
Providence, RI 02908 - PET FRIENDLY
- APPLY INSTANTLYPET FRIENDLY
- APPLY INSTANTLYPET FRIENDLY
- APPLY INSTANTLYPET FRIENDLY
- PET FRIENDLY
- FURNISHED
Explore by feature - Pool
- NEW - 1 DAY AGOSPECIAL OFFERPET FRIENDLY
- PET FRIENDLY$1,900 - $4,325/moStudio-2 bd1-2 baHalstead Providence | 255 Promenade St #P417,
Providence, RI 02908  PET FRIENDLY
 APPLY INSTANTLY
 APPLY INSTANTLY
 APPLY INSTANTLYPET FRIENDLYFURNISHED
 NEW - 17 HRS AGOPET FRIENDLY
 APPLY INSTANTLYPET FRIENDLY
 APPLY INSTANTLY
 APPLY INSTANTLYPET FRIENDLY
Explore by feature - Washer/dryer
- NEW - 1 DAY AGOSPECIAL OFFERPET FRIENDLY
- SPECIAL OFFERPET FRIENDLY
- SPECIAL OFFERPET FRIENDLY
- PET FRIENDLY$1,900 - $4,325/moStudio-2 bd1-2 baHalstead Providence | 255 Promenade St #P417,
Providence, RI 02908 - PET FRIENDLY
- APPLY INSTANTLYPET FRIENDLY
- APPLY INSTANTLYPET FRIENDLY
- APPLY INSTANTLYPET FRIENDLY
- PET FRIENDLY
- PET FRIENDLYTotal price$2,116 - $3,708/moStudio-3 bd1-2 baStation Row Apartments | 10 Park Row #633,
Providence, RI 02903
Explore by feature - Outdoor Space
 NEW - 10 HRS AGOAPPLY INSTANTLYPET FRIENDLY
 APPLY INSTANTLYPET FRIENDLY
 APPLY INSTANTLY
 APPLY INSTANTLY
 APPLY INSTANTLY
 APPLY INSTANTLY
 APPLY INSTANTLYPET FRIENDLY
 APPLY INSTANTLY
 APPLY INSTANTLY
 FURNISHEDROOM FOR RENT
Homes for sale near 45 Capron St


Off Market Homes Near 45 Capron St
 SOLDJUN 30, 2026Broadway Real Estate Group
 SOLDJUN 30, 2026Broadway Real Estate Group
 SOLDJUN 30, 2026Residential Properties Ltd.
 SOLDJUN 30, 2026JPAR Prime Real Estate
 See more homes for sale inProvidence


