


Home Highlights

Single-Family Home

576 sqft

$894/sqft
Local Information
- Map ViewExplore the area around 2112 E 11th St.

- Schools1 Elementary School1 Middle School1 High School

- Shop & Eat
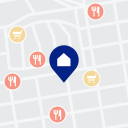
-- mins to
About this House
What's unique:Fully fencedFull kitchenLarge patioFront yard
Single family, 2 story detached home with 1 bedroom, 3/4 bathroom, living room, full kitchen, laundry, large patio, front yard, garden, fully fenced.
Driveway, with rolling gate, has space for 2 cars, parked tandem. Gardener and insect service included.
House is currently vacant - waiting on cleaning team's availability before determining move-in date (no later than 6/1.)
No smoking allowed in home. Pets negotiable.
Driveway, with rolling gate, has space for 2 cars, parked tandem. Gardener and insect service included.
House is currently vacant - waiting on cleaning team's availability before determining move-in date (no later than 6/1.)
No smoking allowed in home. Pets negotiable.
2112 E 11th St, Long Beach, CA 90804 is a 1 bedroom, 1 bathroom, 576 sqft single-family home in East Side. It last sold for $285,000 on Feb 24, 2017 (12,855% above the $2,200 asking price). More recently, it was listed as a rental in May 2026 with an asking price of $2,200 per month. That rental listing was removed on May 28, 2026. This property is not currently displayed as for sale or rent on Trulia. The Trulia Estimate is $515,000, with a rent estimate of $1,879/month.
Home Details for 2112 E 11th St

|
|---|
Heating & Cooling Heating: Wall FurnaceAir ConditioningCooling System: Wall Unit, Window UnitHeating Fuel: Wall Furnace |
Appliances & Utilities DryerMicrowaveRefrigeratorWasher |
Levels, Entrance, & Accessibility Floors: Carpet, Hardwood, Tile |

|
|---|
Property Type / Style Property Type: Single Family Home |

|
|---|
Lease Term: 1 YearAvailable: now |

|
|---|
Parking & Garage Parking: Off Street Parking, On Site |
Comparable Sales for 2112 E 11th St
Address | Distance | Property Type | Sold Price | Sold Date | Bed | Bath | Sqft |
|---|---|---|---|---|---|---|---|
0.25 | Single-Family Home | $555,000 | 10/07/26 | 1 | 1 | 703 sqft | |
0.14 | Single-Family Home | $567,000 | 11/26/25 | 2 | 1 | 600 sqft | |
0.28 | Single-Family Home | $493,000 | 08/31/26 | 2 | 1 | 568 sqft | |
0.31 | Single-Family Home | $464,000 | 06/26/26 | 2 | 1 | 558 sqft | |
0.16 | Single-Family Home | $470,000 | 07/10/26 | 2 | 1 | 980 sqft | |
0.37 | Single-Family Home | $300,000 | 06/26/26 | 2 | 1 | 762 sqft | |
0.52 | Single-Family Home | $501,000 | 12/17/25 | 1 | 1 | 480 sqft | |
0.21 | Single-Family Home | $645,500 | 05/01/26 | 2 | 1 | 796 sqft | |
0.25 | Single-Family Home | $645,000 | 08/20/26 | 2 | 1 | 720 sqft | |
0.44 | Single-Family Home | $200,000 | 08/03/26 | 2 | 1 | 630 sqft |
Nearby homes
Get a sense of prices in the area by checking nearby homes. OFF MARKET
- OFF MARKET
 OFF MARKET
- OFF MARKET
 OFF MARKET
 OFF MARKET
 OFF MARKET
 OFF MARKET
 OFF MARKET
 OFF MARKET
- OFF MARKET
- OFF MARKET
 OFF MARKET
 OFF MARKET
 OFF MARKET
 OFF MARKET
 OFF MARKET
 OFF MARKET
 OFF MARKET

Around this home
Neighborhood Overview

Neighborhood stats provided by third party data sources.
What Locals Say about East Side
This October
Trick-or-Treat Score
Built from what locals say about East Side.- 95% say there are sidewalks
- 57% say there's holiday spirit
- 52% say neighbors are friendly
Trulia Trick or TreatStart Ghost Hunt
At least 241 Trulia users voted on each feature.

95 % Say there are sidewalks

93 % Say it's dog friendly

81 % Say it's walkable to restaurants

74 % Say car is needed

72 % Say it's walkable to grocery stores

65 % Say streets are well-lit

57 % Say there's holiday spirit

54 % Say people would walk alone at night

52 % Say neighbors are friendly

52 % Say yards are well-kept

50 % Say they plan to stay for at least 5 years

49 % Say kids play outside

48 % Say there's wildlife

38 % Say it's quiet

30 % Say parking is easy

18 % Say there are community events
Sourced by Trulia users. Learn more about our methodology.
LGBTQ Local Legal Protections
LGBTQ Local Legal Protections



Price and Tax history
| Date | Event | Price |
|---|---|---|
May 28, 2026 Source: Zillow Rentals | ListingRemoved | $2,200 |
May 18, 2026 Source: Zillow Rentals | Listed For Rent | $2,200 |
Nov 8, 2024 Source: Zillow Rentals | ListingRemoved | $2,200 |
Nov 6, 2024 Source: Zillow Rentals | Listed For Rent | $2,200 |
Feb 24, 2017 Source: N/A | Sold | $285,000 |
Feb 10, 2017 Source: Agent Provided | Pending | $275,000 |
Nov 2, 2016 Source: Agent Provided | PriceChange | $275,000 Price decreased by 7% |
Oct 12, 2016 Source: Agent Provided | PriceChange | $295,000 Price decreased by 2% |
Oct 6, 2016 Source: Agent Provided | Listed For Sale | $299,900 |
Jul 28, 2015 Source: N/A | Sold | $245,000 |
Jun 11, 2015 Source: Agent Provided | Pending | $249,000 |
Apr 22, 2015 Source: Agent Provided | PriceChange | $249,000 Price decreased by 4% |
Apr 6, 2015 Source: Agent Provided | PriceChange | $259,000 Price decreased by 4% |
Mar 12, 2015 Source: Agent Provided | PriceChange | $269,000 Price decreased by 4% |
Feb 19, 2015 Source: Agent Provided | Listed For Sale | $279,900 |
Jul 23, 2012 Source: N/A | Sold | $130,000 |
May 18, 2012 Source: Agent Provided | PriceChange | $131,900 Price increased by 0% |
Apr 25, 2012 Source: Agent Provided | Listed For Sale | $0 |
Mar 30, 2012 Source: N/A | Sold | $276,129 |
May 26, 2006 Source: N/A | Sold | $323,000 |
May 14, 2004 Source: N/A | Sold | $180,000 |
Jan 6, 2004 Source: N/A | Sold | $115,000 |
Jul 3, 2002 Source: N/A | Sold | $112,500 |
Nov 29, 2001 Source: N/A | Sold | $81,500 |
| Year | Property tax | Tax assessment |
|---|---|---|
| 2026 | Unavailable | $337,375 |
Home facts updated by county records
Frequently asked questions about 2112 E 11th St
- What is 2112 E 11th St estimated to be worth?Trulia's estimated value for 2112 E 11th St in Long Beach, CA is $515,000.
- What is the price history for 2112 E 11th St?2112 E 11th St in Long Beach, CA last sold for $285,000 in February 2017.
- Is Long Beach a buyer's or seller's market?Long Beach is currently a buyer's market, based on recent for-sale activity.
- What's the median sale price in Long Beach?The median sale price in Long Beach is $860K. That is up $39.5K from the prior month.
- Does 2112 E 11th St have air conditioning?Yes, 2112 E 11th St in Long Beach, CA has air conditioning.
- Does 2112 E 11th St have laundry facilities?Yes, 2112 E 11th St in Long Beach, CA has in-unit laundry.
Homes for rent near 2112 E 11th St
 PET FRIENDLY

 APPLY INSTANTLY

 ROOM FOR RENT
 APPLY INSTANTLYPET FRIENDLY


 See more homes for rent inLong Beach

Affordability
TIP:Try to keep your rent within a third of your gross household income. Learn why in our Renter's Guide.
For this property
PER YEAR
is the suggested income
Win over prospective landlords with your smart budgeting. As a good rule of thumb, ideally you would have at least three times your monthly rent in combined household income.

- Results are loading