Houses For Rent in Nipomo, CA
8 rentals
 Use arrow keys to navigate
 Use arrow keys to navigate
 Use arrow keys to navigate
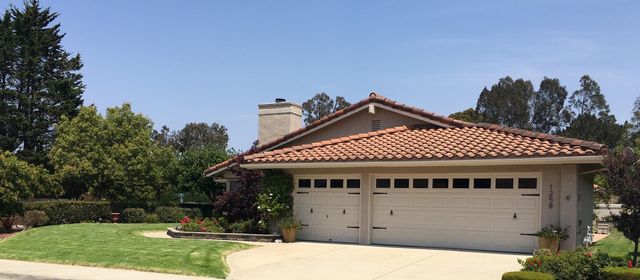 Use arrow keys to navigateAPPLY INSTANTLYFURNISHED
 Use arrow keys to navigateAPPLY INSTANTLYFURNISHED
 Use arrow keys to navigate
 Use arrow keys to navigateFURNISHED
 APPLY INSTANTLYFURNISHED
Save Search in Nipomo, CA
NipomoSingle Family HomeGet emails when new homes match this search


Apartments For Rent Near Nipomo, CA
We found 30 more apartments matching your filters just outside Nipomo
 Use arrow keys to navigateNEW - 11 HRS AGOPET FRIENDLY
 Use arrow keys to navigateNEW - 1 DAY AGOAPPLY INSTANTLY
 Use arrow keys to navigateNEW - 2 DAYS AGOPET FRIENDLY
 Use arrow keys to navigateNEW - 2 DAYS AGO
 Use arrow keys to navigateNEW - 2 DAYS AGOAPPLY INSTANTLY
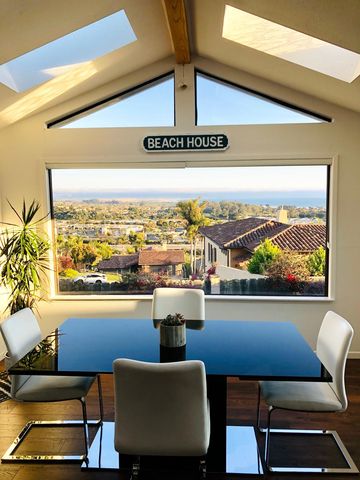 Use arrow keys to navigateNEW - 2 DAYS AGOAPPLY INSTANTLY
 Use arrow keys to navigateNEW - 2 DAYS AGOAPPLY INSTANTLYPET FRIENDLY
 NEW - 2 DAYS AGO
 APPLY INSTANTLYPET FRIENDLY
 PET FRIENDLY
 APPLY INSTANTLY
 APPLY INSTANTLY
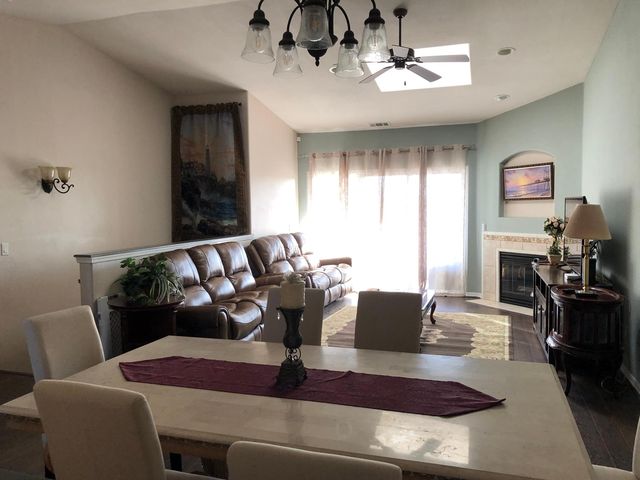 APPLY INSTANTLYFURNISHED
 PET FRIENDLY
 APPLY INSTANTLYPET FRIENDLYFURNISHEDROOM FOR RENT

 PET FRIENDLY
 APPLY INSTANTLY
 APPLY INSTANTLYPET FRIENDLY
 PET FRIENDLY
 APPLY INSTANTLY
 NEW - 1 DAY AGOAPPLY INSTANTLY
 PET FRIENDLY
 PET FRIENDLY
 APPLY INSTANTLY
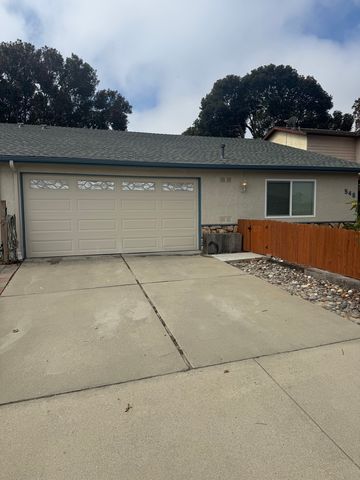 APPLY INSTANTLY
 APPLY INSTANTLY
 APPLY INSTANTLY


Average Rent Trends in Nipomo, CA
Rent in Nipomo, CA varies by number of bedrooms and home type. Use these charts to quickly see how rent changes.
Average rent for a house stayed about the same in Jul 2026 compared to the previous month. Rent for houses peaked in Jun 2025.
| Month | Average rent |
|---|---|
| Aug 2025 | $3,395 |
| Sep 2025 | $4,000 |
| Oct 2025 | $3,000 |
| Nov 2025 | $3,500 |
| Dec 2025 | $3,300 |
| Jan 2026 | $3,950 |
| Feb 2026 | $3,500 |
| Mar 2026 | $3,950 |
| Apr 2026 | $3,800 |
| May 2026 | $3,540 |
| Jun 2026 | $3,494 |
| Jul 2026 | $3,500 |
Average Rent By Bedroom and Home Type
In July 2026, Apartments and Condos were the most affordable home type to rent compared with Townhomes and Houses.
| 1 bed | 2 beds | 3 beds | 4 beds | All | |
|---|---|---|---|---|---|
| All home types | $2,000 | $2,500 | $4,000 | $3,367 | $2,650 |
| Townhomes | — | $2,713 | $2,800 | — | $2,713 |
| Apartments and Condos | $2,000 | $2,200 | — | — | $2,200 |
| Houses | $1,600 | $2,600 | $4,000 | $3,367 | $3,450 |
Frequently Asked Questions about Houses for rent in Nipomo, CA
- What is the average rent of a house in Nipomo, CA?The average rent of a house in Nipomo, CA is $3,450 per month. This is about 77% higher than the national average.
- When is the average rent for a house cheapest in Nipomo, CA?In the last year, the average rent in Nipomo, CA was lowest in Feb 2025 when it was $2,850 per month.
- When is the average rent for a house most expensive in Nipomo, CA?In the last year, the average rent in Nipomo, CA was highest in Jun 2025 when it was $4,750 per month.
- How does the rent of a 3 bedroom house compare to a 2 bedroom house in Nipomo, CA?The average rent of a 3 bedroom house in Nipomo, CA is $4,000 per month. That is about $1,400 more than the cost of a 2 bedroom house.
- How many houses are available to rent in Nipomo, CA?There are 12 available houses to rent in Nipomo, CA.
- What are some cities near Nipomo, CA?Some nearby cities include: Oceano, Grover Beach, Guadalupe, Arroyo Grande, Pismo Beach. These cities may have more rental options to explore.
View this page in Spanish: Casas en renta en los alrededores de Nipomo, CA - 68 Casas | Trulia

Copyright The MLS. All rights reserved. Information is deemed reliable but not guaranteed.