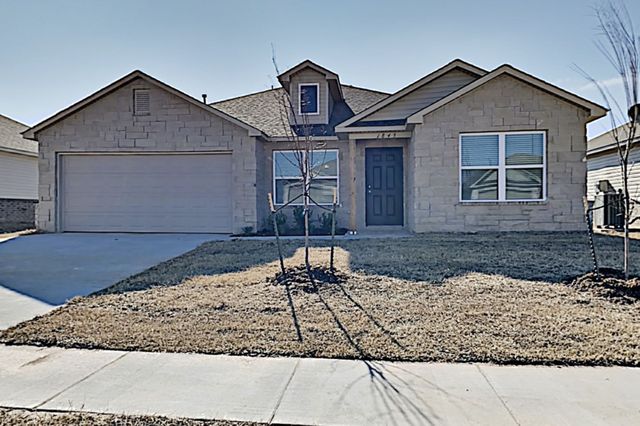
Houses For Rent in El Reno, OK
33 rentals
 NEW - 13 HRS AGO
- NEW - 13 HRS AGO
 Use arrow keys to navigateNEW - 1 DAY AGO
 Use arrow keys to navigatePET FRIENDLY
 Use arrow keys to navigatePET FRIENDLY
 Use arrow keys to navigatePET FRIENDLY
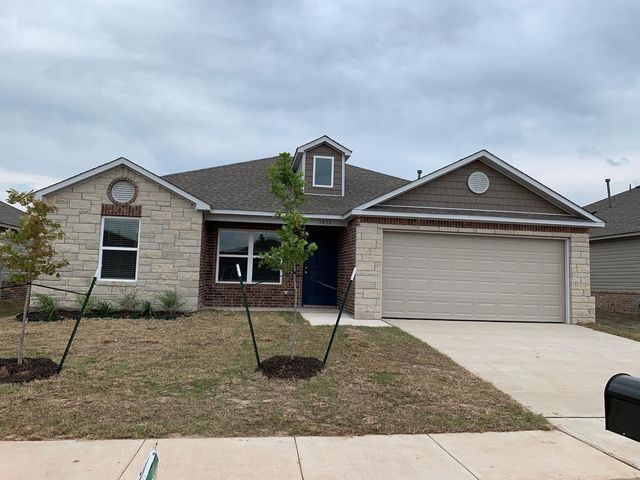 Use arrow keys to navigateAPPLY INSTANTLY
 APPLY INSTANTLYPET FRIENDLY
 PET FRIENDLY
 PET FRIENDLY
 PET FRIENDLY
 PET FRIENDLY
 PET FRIENDLY
 PET FRIENDLY
 PET FRIENDLY
 APPLY INSTANTLYPET FRIENDLY
 PET FRIENDLY
 PET FRIENDLY
- APPLY INSTANTLY
 PET FRIENDLY
 PET FRIENDLY
 PET FRIENDLY
 PET FRIENDLY
 PET FRIENDLY
 PET FRIENDLY
 PET FRIENDLY
 PET FRIENDLY
 PET FRIENDLY
 PET FRIENDLY
 APPLY INSTANTLYFURNISHEDROOM FOR RENT
Save Search in El Reno, OK
El RenoSingle Family HomeGet emails when new homes match this search


Apartments For Rent Near El Reno, OK
We found 30 more apartments matching your filters just outside El Reno
 Use arrow keys to navigateNEW - 38 MIN AGOAPPLY INSTANTLYPET FRIENDLY
 Use arrow keys to navigateNEW - 46 MIN AGOPET FRIENDLY
 Use arrow keys to navigateNEW - 55 MIN AGOAPPLY INSTANTLYPET FRIENDLY
 Use arrow keys to navigateNEW - 2 HRS AGOPET FRIENDLY
 Use arrow keys to navigateNEW - 2 HRS AGO
 Use arrow keys to navigateNEW - 3 HRS AGO
 Use arrow keys to navigateNEW - 4 HRS AGOPET FRIENDLY$1,495 - $2,169/mo
 1-3 Beds
 1-2 BathsTrulo Homes Quail Village | 2300 NW 145th St #172,
Oklahoma City, OK 73134 PET FRIENDLY0.33 ACRES
 PET FRIENDLY
 PET FRIENDLY
 PET FRIENDLY
 PET FRIENDLY
 NEW - 5 HRS AGO
 APPLY INSTANTLYPET FRIENDLY
- NEW - 14 HRS AGOPET FRIENDLY
 NEW - 17 HRS AGOAPPLY INSTANTLYPET FRIENDLY
 NEW - 17 HRS AGOPET FRIENDLY
 NEW - 17 HRS AGOPET FRIENDLY
 NEW - 17 HRS AGO
 NEW - 18 HRS AGOPET FRIENDLY
 NEW - 19 HRS AGOAPPLY INSTANTLYPET FRIENDLY
 NEW - 19 HRS AGOAPPLY INSTANTLY
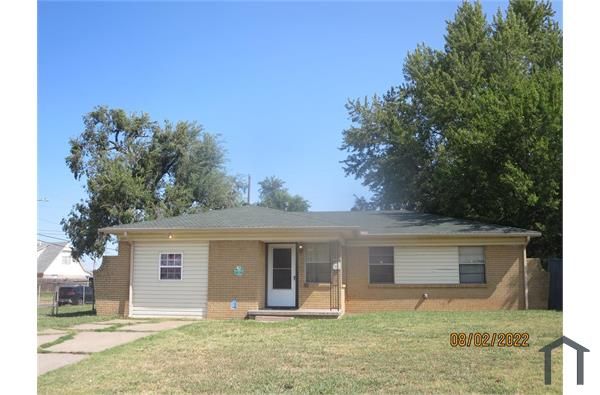 NEW - 19 HRS AGO
 NEW - 19 HRS AGOAPPLY INSTANTLYPET FRIENDLY
 NEW - 20 HRS AGOAPPLY INSTANTLYPET FRIENDLY
 NEW - 20 HRS AGOPET FRIENDLY
 NEW - 20 HRS AGOPET FRIENDLY
 NEW - 20 HRS AGOPET FRIENDLY
 NEW - 20 HRS AGOPET FRIENDLY
 NEW - 21 HRS AGOAPPLY INSTANTLYPET FRIENDLY


Average Rent Trends in El Reno, OK
Rent in El Reno, OK varies by number of bedrooms and home type. Use these charts to quickly see how rent changes.
Average rent increased in May 2026 compared to the previous month. Rent previously peaked in Mar 2025.
| Month | Average rent |
|---|---|
| Jun 2025 | $1,650 |
| Jul 2025 | $1,599 |
| Aug 2025 | $1,595 |
| Sep 2025 | $1,545 |
| Oct 2025 | $1,595 |
| Nov 2025 | $1,428 |
| Dec 2025 | $1,490 |
| Jan 2026 | $1,590 |
| Feb 2026 | $1,545 |
| Mar 2026 | $1,550 |
| Apr 2026 | $1,500 |
| May 2026 | $1,550 |
Average Rent By Bedroom and Home Type
In May 2026, Apartments and Condos were the most affordable home type to rent compared with Houses.
| 1 bed | 2 beds | 3 beds | 4 beds | All | |
|---|---|---|---|---|---|
| All home types | $700 | $1,100 | $1,475 | $1,650 | $1,500 |
| Apartments and Condos | $695 | $1,046 | $1,475 | $1,550 | $1,399 |
| Houses | $865 | $1,250 | $1,475 | $1,650 | $1,550 |
Frequently Asked Questions about Houses for rent in El Reno, OK
- What is the average rent of a house in El Reno, OK?The average rent of a house in El Reno, OK is $1,550 per month. This is about 20% lower than the national average.
- When is the average rent cheapest in El Reno, OK?In the last year, the average rent in El Reno, OK was lowest in Nov 2025 when it was $1,428 per month.
- When is the average rent most expensive in El Reno, OK?In the last year, the average rent in El Reno, OK was highest in Mar 2025 when it was $1,650 per month.
- How many houses are available to rent in El Reno, OK?There are 33 available houses to rent in El Reno, OK.
- What are some zip codes in El Reno, OK?
- What are some cities near El Reno, OK?Some nearby cities include: Calumet, Union City, Yukon, Okarche, Piedmont. These cities may have more rental options to explore.