Burnet, TX Apartments For Rent
125 rentals
 Use arrow keys to navigateSPECIAL OFFERPET FRIENDLY$1,159 - $2,029/mo
 Studio-3 Beds
 1-2 BathsFLATZ 830 | 6025 S US Highway 281 #4101,
Marble Falls, TX 78654 Use arrow keys to navigateSPECIAL OFFERPET FRIENDLY$1,250 - $1,450/mo1-2 Beds1-2 BathsTwo Rivers Townhomes | 1106 Brazos St #603,
Marble Falls, TX 78654 Use arrow keys to navigateSPECIAL OFFERPET FRIENDLY$1,208 - $1,616/moStudio-2 Beds1-2 BathsResidences At Panther Hollow | 501 Panther Hollow Dr #8303,
Marble Falls, TX 78654 Use arrow keys to navigateSPECIAL OFFERPET FRIENDLYTotal price$1,161 - $1,556/mo1-2 Beds1-2 BathsProse Thunder Rock | 1201 Centurion Pkwy #12205,
Horseshoe Bay, TX 78657 Use arrow keys to navigateSPECIAL OFFERPET FRIENDLY$1,499 - $2,250/mo1-3 Beds1-3 BathsparcHAUS at Mustang Drive | 1601 Mustang Dr #101,
Marble Falls, TX 78654 Use arrow keys to navigatePET FRIENDLY
 Use arrow keys to navigateAPPLY INSTANTLYPET FRIENDLY
 NEW - 1 HR AGOPET FRIENDLY
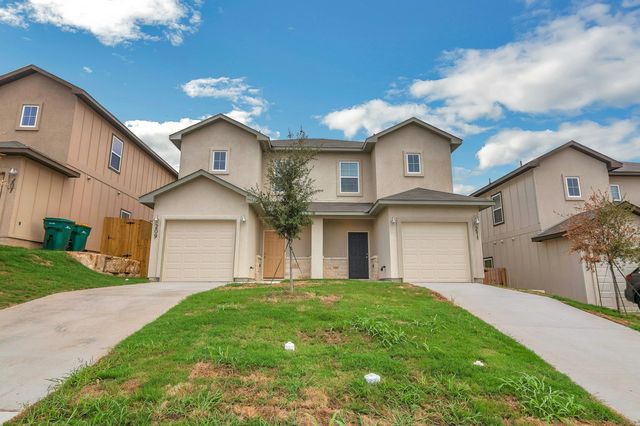 PET FRIENDLY
 PET FRIENDLY
 PET FRIENDLY
 PET FRIENDLY
 PET FRIENDLY
 NEW - 2 DAYS AGOAPPLY INSTANTLYPET FRIENDLYFURNISHED
 APPLY INSTANTLYPET FRIENDLY
 APPLY INSTANTLYPET FRIENDLY
 APPLY INSTANTLYPET FRIENDLY
 APPLY INSTANTLYPET FRIENDLYFURNISHED
 PET FRIENDLY
 APPLY INSTANTLYPET FRIENDLYFURNISHED
 APPLY INSTANTLYPET FRIENDLY
 APPLY INSTANTLYPET FRIENDLY
 APPLY INSTANTLYPET FRIENDLYFURNISHED
 APPLY INSTANTLYPET FRIENDLY
 APPLY INSTANTLYPET FRIENDLY
 APPLY INSTANTLY
 PET FRIENDLYFURNISHED
 PET FRIENDLY
 PET FRIENDLYFURNISHED
 PET FRIENDLY
- PET FRIENDLY
- PET FRIENDLY
- PET FRIENDLY
- PET FRIENDLY
- PET FRIENDLY
- PET FRIENDLY
 PET FRIENDLY
 PET FRIENDLY
- PET FRIENDLY
Explore by rental type - Single Family
 PET FRIENDLY
 PET FRIENDLYFURNISHED
 PET FRIENDLY
 PET FRIENDLY
Explore by rental type - Condo
 PET FRIENDLY
 PET FRIENDLY
 PET FRIENDLY
- PET FRIENDLY
- PET FRIENDLY
- PET FRIENDLY
- PET FRIENDLY
 PET FRIENDLY
- PET FRIENDLY
- PET FRIENDLY
Explore by feature - Air Conditioning
- PET FRIENDLY
- PET FRIENDLY
- PET FRIENDLY
- PET FRIENDLY
 PET FRIENDLY
- PET FRIENDLY
- PET FRIENDLY
- PET FRIENDLY
- PET FRIENDLYFURNISHED
Explore by feature - Garage
- PET FRIENDLY
- PET FRIENDLY
- PET FRIENDLY
- PET FRIENDLY
- PET FRIENDLY
- PET FRIENDLY
- PET FRIENDLY
- PET FRIENDLY
- PET FRIENDLY
Explore by feature - Pet Friendly
- PET FRIENDLY
- PET FRIENDLY
- PET FRIENDLY
- PET FRIENDLY
- PET FRIENDLY
- PET FRIENDLY
- PET FRIENDLY
- PET FRIENDLY
- PET FRIENDLYFURNISHED
- PET FRIENDLY
Explore by rental type - Single Family
- PET FRIENDLY
- PET FRIENDLYFURNISHED
- PET FRIENDLY
- PET FRIENDLY
Explore by rental type - Condo
- PET FRIENDLY
- PET FRIENDLY
- PET FRIENDLY
- PET FRIENDLY
- PET FRIENDLY
- PET FRIENDLY
- PET FRIENDLY
- PET FRIENDLY
- PET FRIENDLY
- PET FRIENDLY
Explore by feature - Air Conditioning
- PET FRIENDLY
- PET FRIENDLY
- PET FRIENDLY
- PET FRIENDLY
- PET FRIENDLY
- PET FRIENDLY
- PET FRIENDLY
- PET FRIENDLY
- PET FRIENDLYFURNISHED
Explore by feature - Garage
- PET FRIENDLY
- PET FRIENDLY
- PET FRIENDLY
- PET FRIENDLY
- PET FRIENDLY
- PET FRIENDLY
- PET FRIENDLY
- PET FRIENDLY
- PET FRIENDLY
Explore by feature - Pet Friendly
- PET FRIENDLY
- PET FRIENDLY
- PET FRIENDLY
- PET FRIENDLY
- PET FRIENDLY
- PET FRIENDLY
- PET FRIENDLY
- PET FRIENDLY
- PET FRIENDLYFURNISHED
- PET FRIENDLY


What Locals Say about Burnet
Average Rent Trends in Burnet, TX
Rent in Burnet, TX varies by number of bedrooms and home type. Use these charts to quickly see how rent changes.
Average rent increased in Jun 2026 compared to the previous month. Rent previously peaked in Dec 2025.
| Month | Average rent |
|---|---|
| Jul 2025 | $1,495 |
| Aug 2025 | $1,695 |
| Sep 2025 | $1,695 |
| Oct 2025 | $1,995 |
| Nov 2025 | $1,900 |
| Dec 2025 | $2,023 |
| Jan 2026 | $2,195 |
| Feb 2026 | $1,995 |
| Mar 2026 | $1,995 |
| Apr 2026 | $1,900 |
| May 2026 | $1,500 |
| Jun 2026 | $1,800 |
Average Rent By Bedroom and Home Type
In June 2026, Apartments and Condos were the most affordable home type to rent compared with Houses and Townhomes.
| 1 bed | 2 beds | 3 beds | 4 beds | All | |
|---|---|---|---|---|---|
| All home types | $1,500 | $869 | $1,595 | $2,000 | $1,595 |
| Townhomes | — | — | $1,800 | — | $1,800 |
| Apartments and Condos | $1,500 | — | — | — | $1,500 |
| Houses | — | $1,195 | $1,500 | $2,000 | $1,595 |
Frequently Asked Questions about Rentals in Burnet, TX
- What is the average rent of an apartment in Burnet, TX?The average rent of an apartment in Burnet, TX is $1,185 per month. This is about 39% lower than the national average.
- What is the average rent of a house in Burnet, TX?The average rent of a house in Burnet, TX is $1,595 per month. This is about 18% lower than the national average.
- What is the average rent of a townhome in Burnet, TX?The average rent of a townhome in Burnet, TX is $1,800 per month. This is about 8% lower than the national average.
- When is the average rent cheapest in Burnet, TX?In the last year, the average rent in Burnet, TX was lowest in Apr 2025 when it was $1,495 per month.
- When is the average rent most expensive in Burnet, TX?In the last year, the average rent in Burnet, TX was highest in Dec 2025 when it was $2,023 per month.
- How many available rental listings are in Burnet, TX?There are 16 available rental listings in Burnet, TX.
- What are some zip codes in Burnet, TX?
- What are some cities near Burnet, TX?Some nearby cities include: Buchanan Dam, Bluffton, Bertram, Tow, Kingsland. These cities may have more rental options to explore.

Data provided by HAR.com 2024 - All information provided should be independently verified.