Who doesn’t love WebPagetest? The browsers, the insight, the configurability, it’s got everything. But, unfortunately, it also has an interface that only it’s creator could love.
So I’m happy to announce the open source release of Trulia’s WebPagetest Charts API. It was built to run and store WebPagetest test results, and provide endpoints to allow better visualization and exploration of the data. This is demonstrated with the companion project WebPagetest Charts UI that builds charts with the API endpoints.

This tool has proven to be very helpful for us at Trulia, particularly with mobile websites, and we wanted to share it to help others improve their mobile web (and regular web) experiences.
As UIs get more complex, especially on a mobile network, trying to sort out a regression in performance can be really difficult. Having a visible history with a filmstrip and links right into the full WebPagetests results has been a very powerful tool. When trying to see what causes a visitor “bad times,” a history of requests is great to peruse. By flicking through the results it’s easy to see the patterns and get a sense of what’s a consistent contributor to mediocre performance.

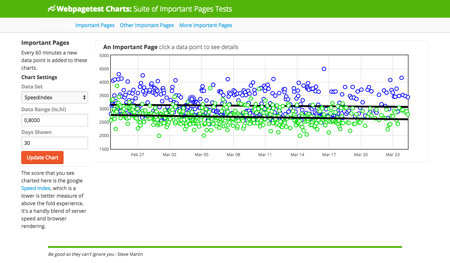
WebpageTest also gives you access to Google’s Speed Index, which is one of their key performance factors for SEO:
Nobody knows exactly how SpeedIndex factors in, but at this point, if SEO matters to your buisiness it’d be irresponsible to not occasionally view your performance through Google’s eyes.
As mentioned above, there are two node applications that you can get on Github:
This is a node server that runs tests on a schedule and offers up charting endpoints. Use it to power whatever you want with the data (custom dashboards, alerts, CI systems, etc). If you just want the data, this is all you need.
Another node server that does charting and datapoint display using the api and its data. It’s a pretty way to make a performance point to non-technical stakeholders (the filmstrips have proven invaluable), or just browse performance data.
If you have any questions about getting set up, or if you want to contribute, GitHub Issues and PRs are the best way. While this code is used internally for important things in Trulia, it’s still a young project so there will probably be bugs for new and different use cases. We’ll be making improvements as we continue to figure out how to best measure performance.