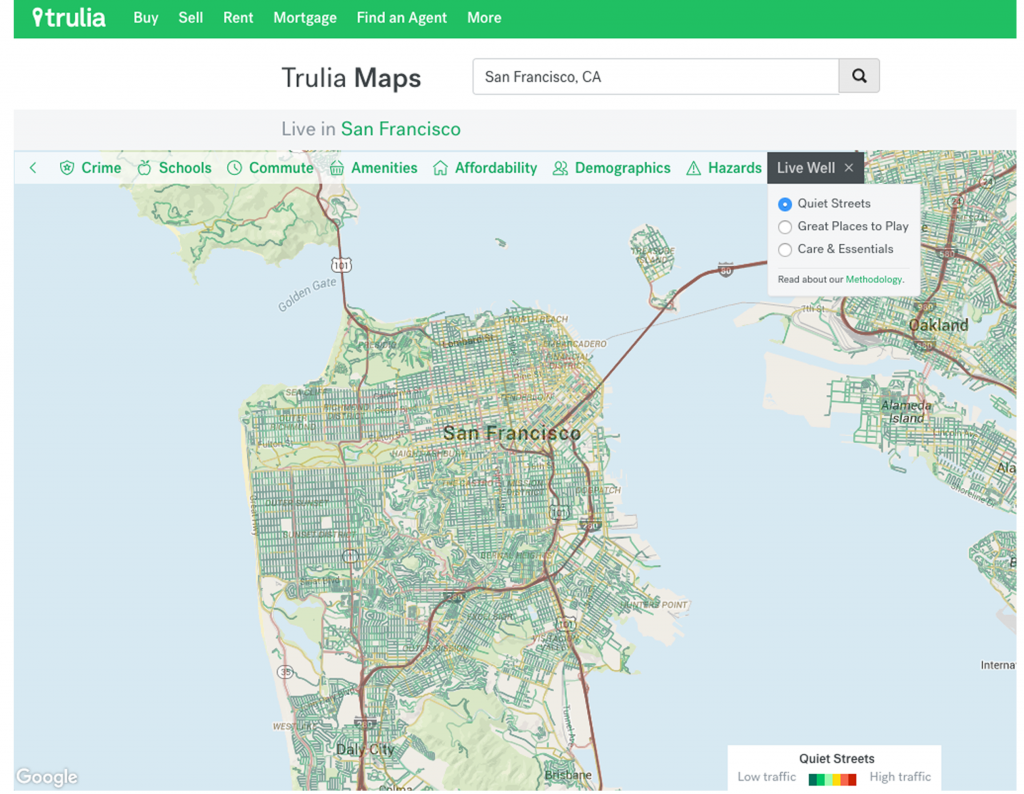
Last week, Trulia released its eighth set of maps, dubbed Live Well. Similar to the existing maps on Trulia, the Live Well set is made up of a few different maps: Quiet Streets, Great Places to Play, and Care and Essentials, marking Trulia’s 32nd, 33rd and 34th interactive maps. While all layers are equally interesting and come together to give house hunters a holistic view of what to expect in a neighborhood, I’m particularly excited about the development of the Quiet Streets layer, which I’ll explain here.

Trulia’s New Quiet Streets Map
Where It All Began
This project began as a simple pitch at one of Trulia’s quarterly Innovation Weeks to answer the question: “Can we identify homes that are on quiet streets?” Under the rules of Innovation Week, we had one week to take this from abstract idea to prototype. In those few days we produced a very interesting map but we weren’t fully satisfied with the result and knew we could iterate and experiment to achieve something better, so we did.
Project Expansion: Estimating Traffic by Graph Centrality
In theory, road networks and social networks are similar. One way to better understand social networks is to use various algorithms that describe how central a given person is in the network. With this mind, we consulted with our Data Science team and looked into Betweenness Centrality and the closely related Stress Centrality to better build out this map. Definitions vary, depending on the author, but Stress Centrality can usually be described as:
- For all pairs of nodes in the graph, calculate the shortest path between them.
- A shortest path adds one to the centrality score of each edge or node it crosses.
- If there are multiple paths between a pair of nodes that are tied for shortest path, those paths add only a fractional amount to the centrality score of each node or edge they cross
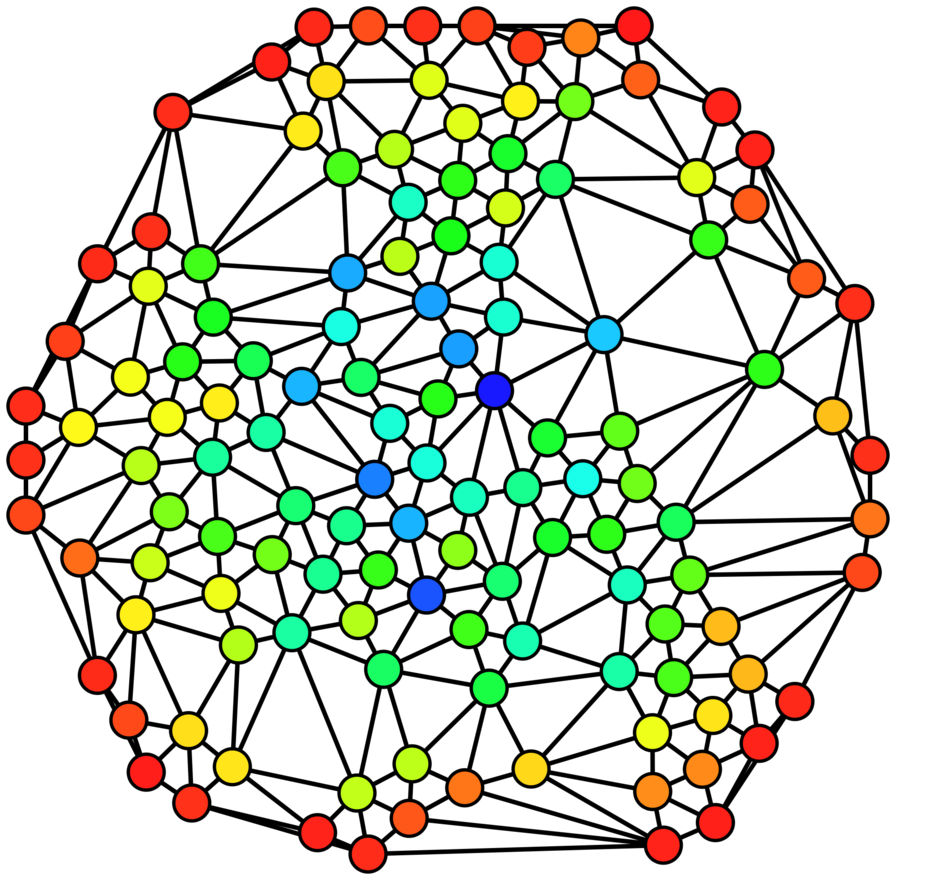
The colors show the degrees of betweenness in this graphic representation. Blue is the highest while red is the lowest.
Stress Centrality looked especially promising, and there’s a relatively efficient algorithm to calculate it in O(N^2), where N is the number of nodes. Several off-the-shelf packages exist to calculate this metric, such as seen here.
For this map, we decided to calculate the Stress Centrality of all-origins to all-destinations-within-one-hour. As far as we’re aware, there weren’t any existing software packages to compute a metric like this, so it had to be implemented by hand. However, this modified centrality metric also had the pleasant side effect of making parallelizing the computation pretty easy – we could partition the road network into segments of an approximately one-hour radius, run computations in parallel on each of those shards, and then combine the results. Our software engineer wrote this up, kicked off the computation on an 8-core machine, and waited. For two months.
The end result looked pretty good though! Clear dead-ends always had a lower weight than nearby arteries, and there was a pretty clear gradient from less busy to busier roads.
But, as we started to try and break down the road traffic score into individual categories, we realized a problem: roads in urban areas always had a higher score than similar roads in rural areas. Also, roads in more densely mapped areas, or areas with more complicated road networks, tended to have a higher score. The problem was that stress centrality assumed that the number of destination nodes is what was important.
Thankfully the fix was simple – instead of incrementing the centrality score by one for every path that crosses an edge, each origin node had one point worth of score to distribute, among all shortest-paths that originate from it. This represented about three lines of change in the computation program, but a re-computation time of two months!
We didn’t want to wait that long. So, we leveraged AWS’s EC2 to quickly provision a ton of computational power. For this project, EC2s spot instances were ideal – they offer a great way to get a lot of computational power for low cost, but with the risk of your instances being shut down with little warning. As long as a shard’s computation could save its progress and resume on a new machine, spot instances could work wonderfully.
With this setup, the entire nation was recalculated in two days.
Publishing Quiet Streets
As a result of the team’s hard work, consumers who visit Trulia can now search for homes with quiet streets anywhere in the country. Not only does this give home-shoppers even more insight into the neighborhood’s they’re interested in, it can give many parents peace of mind. Go check out the new maps now and let us know what you think in the comments below.