In addition to the award-winning apps Trulia offers for consumers looking to rent or buy a new home, we build amazing tools that help real estate professionals manage their business. We recently released a huge upgrade to our professional app. As part of the upgrade, we wanted to also optimize how we store, maintain, and retrieve data and thus needed to move all our users’ information from an old database to a new. A successful migration is vital here since agents aren’t able to use our new app if the migration of their information is corrupted in any way. So, we’re putting a huge emphasis on monitoring to ensure we have insight into what exactly is happening at each point in this year-long migration process.
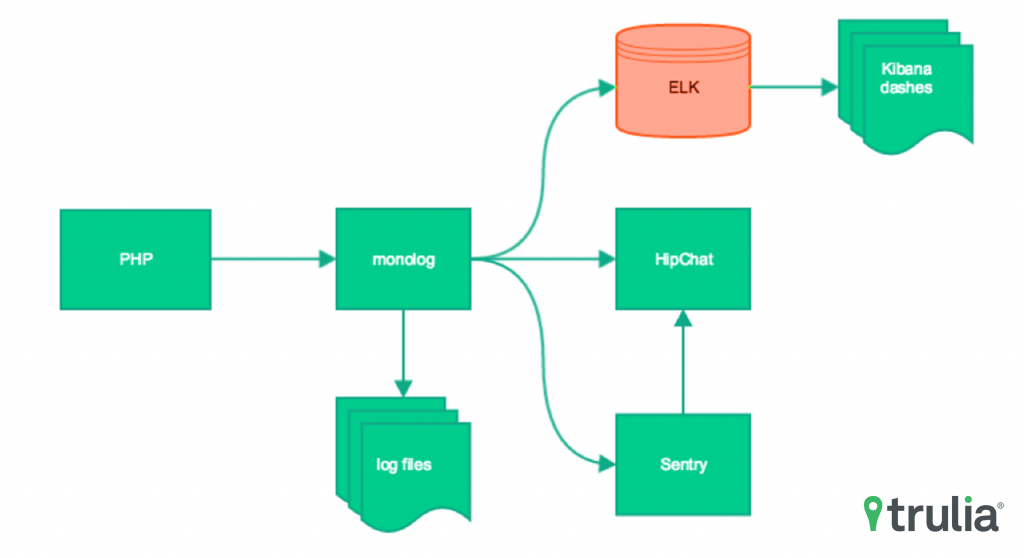
The technologies we chose for our monitoring stack are Elasticsearch/Logstash/Kibana (ELK), Sentry, HipChat, and Monolog. I’ll walk you through how we use each.

Trulia app migration stack
The Paranoid Design Pattern
I personally subscribe to the paranoid school of programming, so the more redundancy the better. When stuff breaks, I want to know about it; the more places the better.
I typically like to start with noisy logging and dial down the verbosity as the application grows and I get a better handle on what’s happening. Everything we’re interested in is logged directly to a text-based log file, and errors go to Sentry and HipChat. We’re not only logging errors, but milestone events in the migration process so we can pinpoint how long the various subprocesses are taking, how much memory they use, etc.
We’re also logging to a logstash-ready file that ends up in Elasticsearch. We then use Kibana to filter, and slice and dice the logs to extract different kinds of information. Our application is database intensive and works in batches, saving big chunks of datasets at different stages. We can use Kibana to view an entire migration run for a user, see where it failed and which parts of the user’s data were successfully copied to the new database.
Our group uses PHP mostly and so we’re using monolog as our logging framework. It’s simple to configure and use, has lots of plugins for logging to different streams (e.g. HipChat, email) and is well-tested and under active development.
Error Aggregation with Sentry
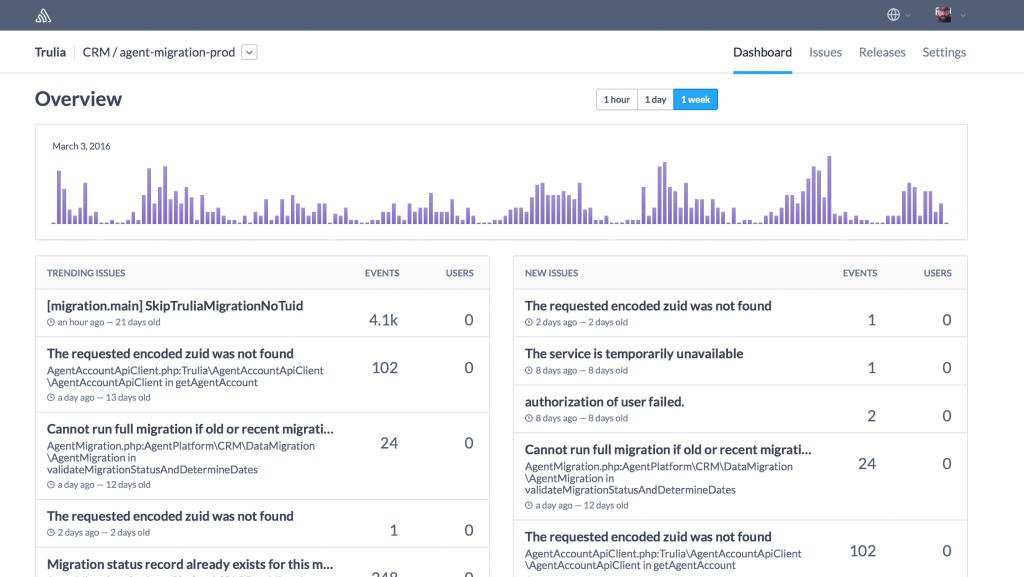
We’ve also been using the error aggregation service Sentry for the past few years and decided to leverage that as part of this monitoring stack as well. With clients for all major languages, it’s easy to tie error and exception reporting into almost any application. We create error and exception handlers to capture unexpected issues and send them to Sentry. Sentry client software also allows us to send messages to Sentry explicitly. Sentry provides lots of environmental and contextual metadata for each error it receives, which allows for easier replay of processes where errors occurred.

Trulia Sentry dashboard
HipChat: The Golden Hammer
My favorite part of the monitoring stack is the integration with HipChat. Both Sentry and a Monolog logger feed into our HipChat alerts room, allowing us to monitor errors as they happen.
Sentry sends an email notification when a new error occurs, or if there’s a regression. But, because we only get one notification from Sentry, we don’t know if the error is transitory or happening over and over. With our HipChat alerts room, we can see the error stream in real-time without logging into a server and tailing a log file.
We also link our Jenkins build and deploy jobs with HipChat so we can see quickly when our build fails or deploys successfully. It’s much better than monitoring a noisy email inbox, and Jenkins allows us to control which parts of the job we’re interested in.
By leveraging these monitoring technologies we’re able to quickly identify and resolve issues that negatively affect our agent end-users, providing them with a smooth transition to using our Premier Agent mobile app, and helping them stay connected with their clients.


