
With Christmas just around the corner, kids everywhere are anxiously awaiting a visit from Old Saint Nick. And while Santa has his A-team of reindeer, elves and his magic sleigh to help him out on Christmas Eve, here at Trulia we wanted to know where he would spend the most time delivering holiday cheer. Even with Rudolph’s guiding light, Santa isn’t exempt from delays, so where does Santa experience his biggest slowdown?
To calculate this index, Trulia took a look at the top 100 metro areas by the population of children, number of single-family and multi-family homes, as well as geographic factors like tree cover and Yelp API data for ski resorts and snowy features – good ski conditions can also mean snowy delays!
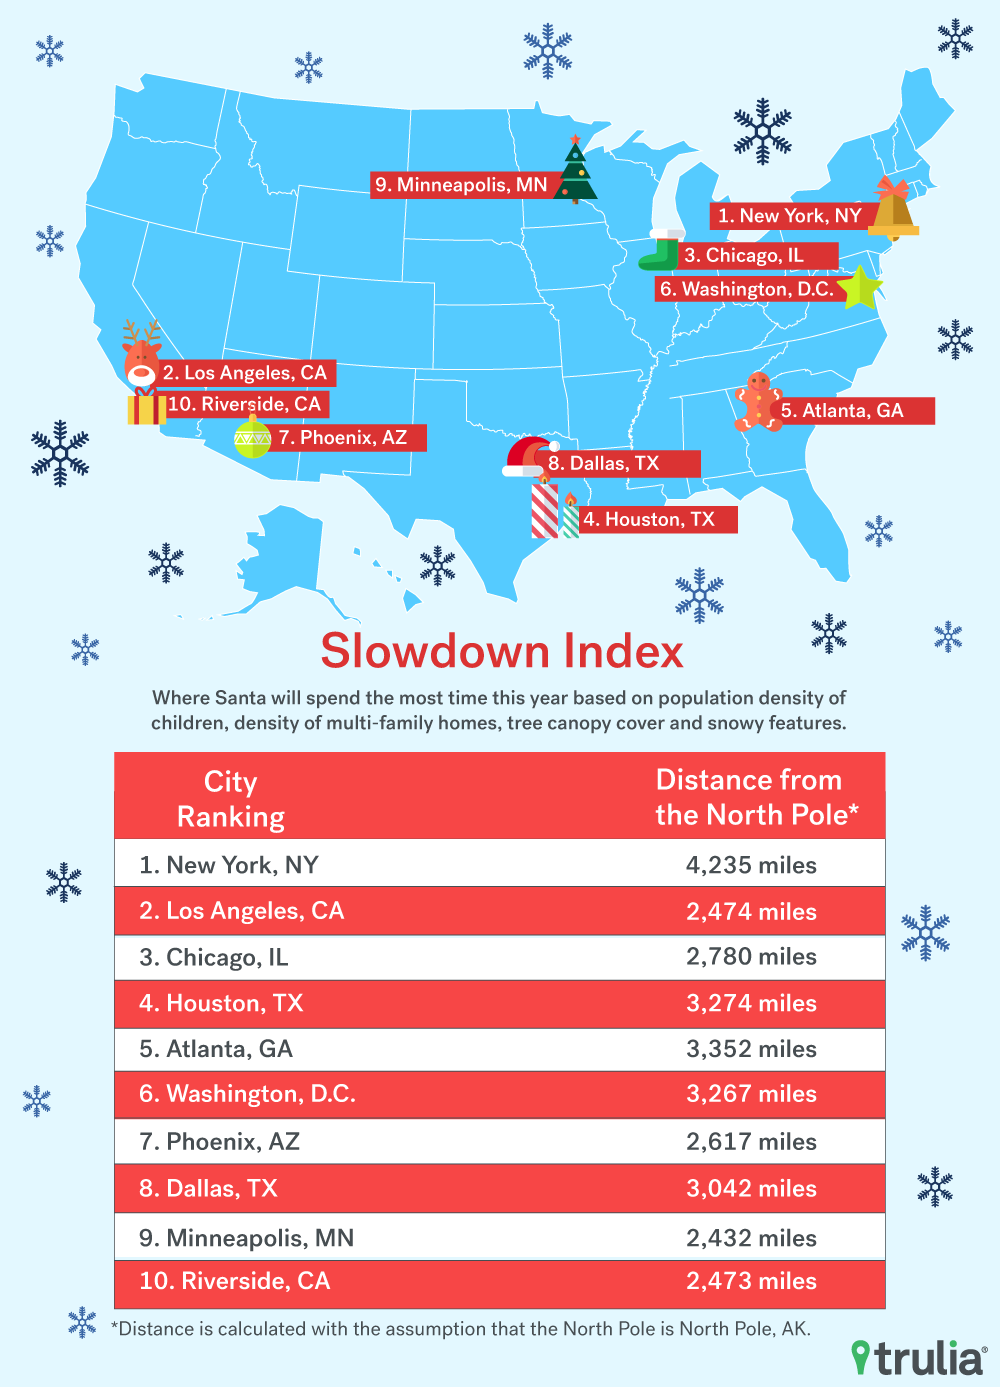
Trulia found that Santa, although speedy for his age, can empathize with the gridlock of New York. While he won’t be getting stuck on the GW Bridge, Santa must fly to a lot of homes in the Big Apple, which puts New York City at the top of our Slowdown List, while cities like, Colorado Springs, CO, Toledo, OH and Wichita, KS are the cities within the top 100 metros were Santa spends the least time.
Check out our full ranking of Slowdown Cities below to see where your hometown ranks. And just in case you want to help Santa out and pick up your presents at Santa’s house in North Pole, Alaska, we crunched the numbers on how far you’d have to travel.
If your city didn’t make the Slowdown list this year, our interactive map will give you an idea of where Santa spends the most time near your home! And no matter where you live, be sure to listen closely for a bellowing “Merry Christmas to all, and to all a goodnight!”
Methodology: To calculate our Santa Slowdown Index, we looked at a combination of Geonames and Yelp data on the population density of children, density of multi-family homes as well as tree canopy cover and snowy features, which includes skiing, sledding and snowmobiling. We then calculated the index for the top 100 metro areas in the U.S.