For the first time in the past five years, when evaluating the economics of renting versus buying, renting has come out best in two West Coast metros: San Jose, Calif. and San Francisco—places where home values have soared and surpassed the $1 million mark, while rents have flattened or sunk. And, in a few other markets, including Honolulu and Seattle, the savings from buying have melted away, leaving buying with only a slim advantage.
To be sure, in most places, buying is still a significantly better financial proposition. But, looking nationwide, the steady upward march of home prices has shrunk the savings from buying in every one of the country’s 100 largest markets.
To calculate the cost of renting versus buying, we assume households stay in their homes for seven years, can afford to put 20% down and take on a 30-year fixed rate mortgage when buying their homes. In this report, we use July 2018 home values and rents to examine how this decision pencils out. Here are our key findings:
- Nationally, in July 2018, the financial advantage of buying over renting hit a six- year low, although buying still saves 26.3%.
- This dip in savings from buying is driven in part by cooling rents, which have dropped or remained flat in 82 of the 100 largest markets, with 51 of them seeing rental prices fall over the past year.
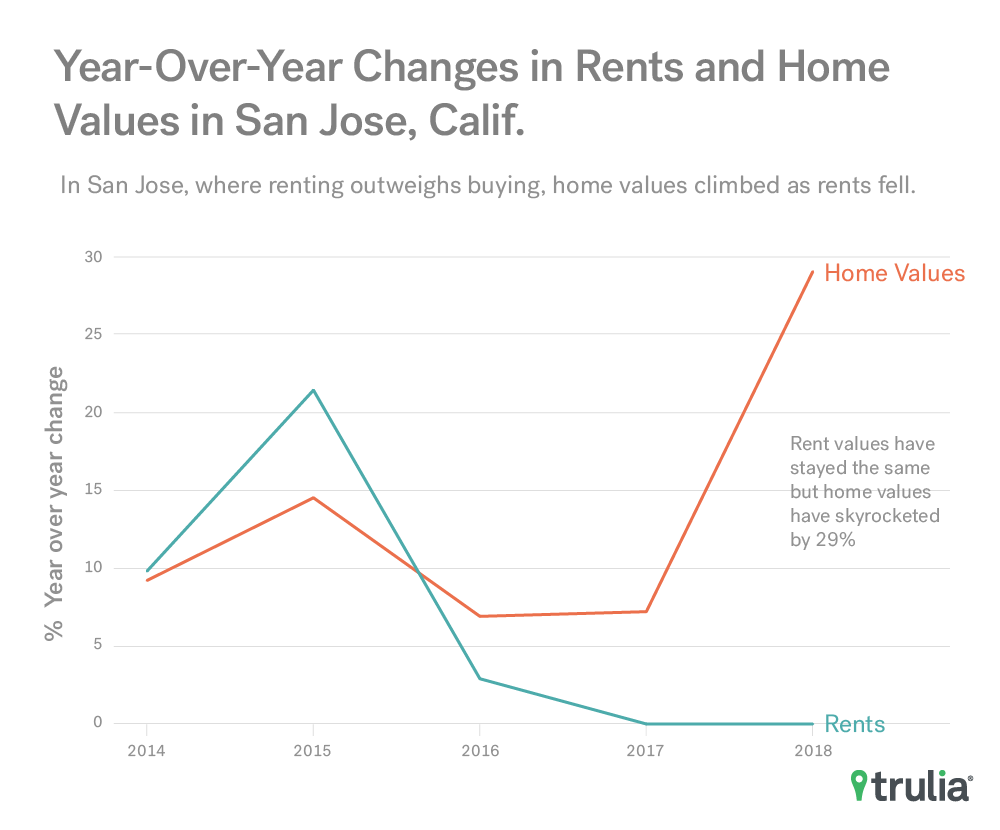
- In the nation’s two priciest metros, San Jose and San Francisco, the savings from renting amount to 12.2% and 5.8% respectively. In San Jose, home prices have rocketed a whopping 29.0% since last year, while rents have remained unchanged.
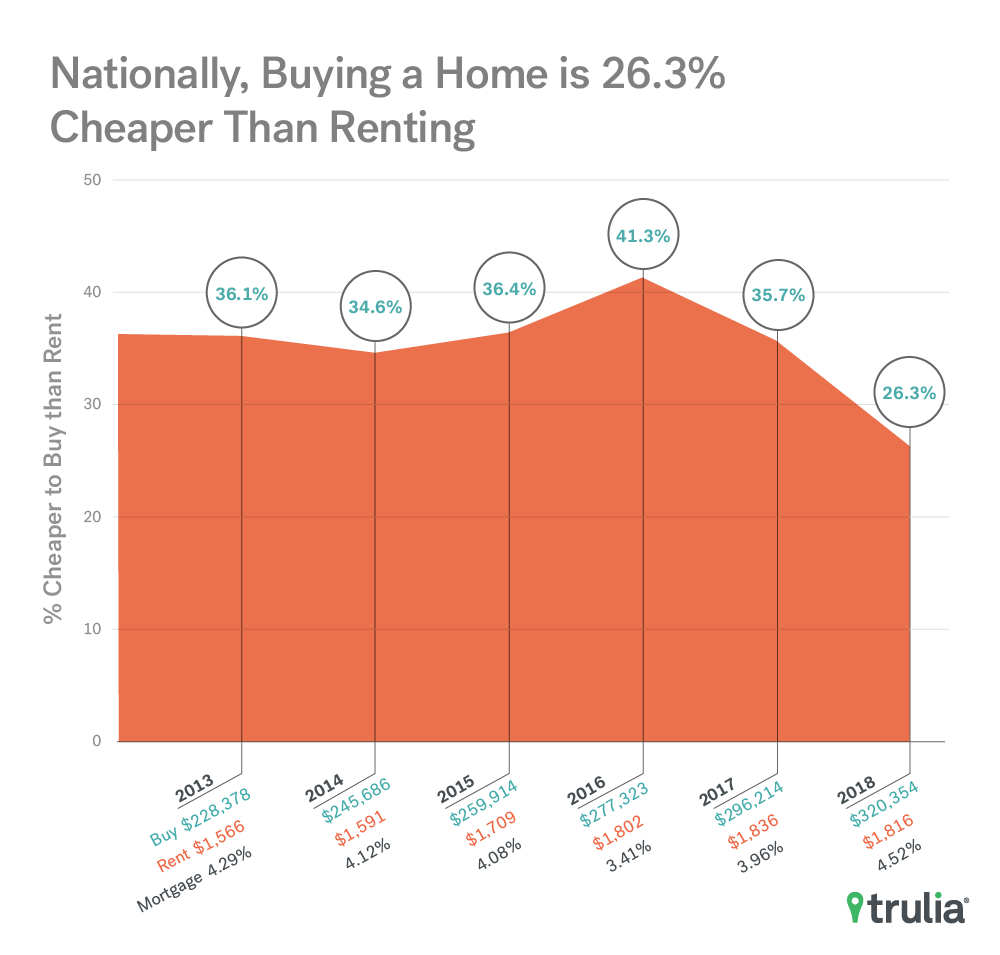
Nationally, in July, the financial benefit of buying over renting reached its lowest level since Trulia began tracking renting versus buying five years ago, dipping to 26.3% from 35.7% a year ago. Over this same period, rents registered their first annual decline—down 1.1%—while home prices continued their rise—up 8.1%. The divergence of home values and rents drove the 9.4 percentage point drop in savings from buying—the largest annual change in five years.
As mortgage rates edge higher, they have a significant impact on the rent-versus-buy decision. From 2015 to 2016, when changes in home prices and rents were more aligned, mortgage rates were the key factor driving the rent-versus-buy decision. Rates decreased 0.67 percentage points from the first week of July in 2015 to that same time period in 2016, which helped give buying a 41.3% advantage over renting. These days, diverging home values and rents combined with higher mortgage rates are eating away at the savings from buying. All the same, on a national level, these trends have not eliminated the considerable advantage buying has over renting.
With Home Values in the Millions of Dollars, Renting Reigns in the Bay Area
For as long as we have run this report, renting has never been a better deal than buying. But this summer, driven by epic home price appreciation and lifeless rents, renting tips the scales over buying in San Jose and San Francisco. Home values in San Jose have soared 29.0% since last year, while, in San Francisco, home values rose 14.2%. Escalating prices are driving homes further out of reach, but there’s a silver lining for home seekers in these Bay Area markets: Rents were unchanged in San Jose and fell 3.0% in San Francisco.
Other markets among the 10 places where the margin between renting and buying was slimmest include metros that led in home price appreciation across the nation, such as Seattle and Las Vegas. Other places where buying offers scant savings are noteworthy for having high home values relative to rents, such as Oakland, Calif., Sacramento, Calif. and Portland, Ore. despite flat or declining rents.
Where the Savings from Buying over Renting are Slimmest
| Metro | % Renting Cheaper than Buying | Median Home Value | Median Rent Value |
| San Jose, CA | 12.2% | $1,281,215 | $3,500 |
| San Francisco, CA | 5.8% | $1,399,188 | $4,095 |
| Honolulu, HI | -2.0% | $691,978 | $2,400 |
| Seattle, WA | -10.0% | $589,265 | $2,375 |
| Portland, OR | -13.8% | $397,691 | $1,895 |
| Madison, WI | -14.7% | $255,224 | $1,495 |
| Milwaukee, WI | -15.5% | $225,967 | $1,375 |
| Sacramento, CA | -15.8% | $407,268 | $1,900 |
| Oakland, CA | -16.3% | $684,871 | $2,900 |
| Las Vegas, NV | -16.8% | $272,619 | $1,350 |
On the other end of the spectrum, buying over renting is a no-brainer in many markets. In most of these places, home values are relatively low compared with the cost of renting. Still, there are some surprising trends. For instance, Detroit posted an 18.3% increase in home values, trailing only San Jose. But Detroit is also the metro where buying saves the most over renting—48.9% over seven years. Although Detroit home values have gone up considerably, the median remains relatively low—just over $70,500. So even though rents fell 5.0%, buying still makes sense.
One point deserves emphasizing: The ultra-costly San Francisco Bay Area is not a harbinger for the nation as a whole. While renting may outweigh buying in San Jose and San Francisco, it is unlikely that renting will tip the scales nationally anytime soon. Nevertheless, prospective home buyers face the daunting task of finding a home they can afford amid chronically low levels of inventory. So, with rent values on the wane in many places, home values on the rise and borrowing rates trending steadily upward, in a number of markets, people looking for a new place to live may take a little longer to decide whether this is the right time to take out a mortgage or sign a lease.
Click here for the full data set.
Methodology
The following outlines how Trulia calculates the costs of buying and renting:
- We use our quality-adjusted measure of home prices and rents, which allows an apples-to-apples comparison between rental and owner-occupied housing units. We looked at median home values and rents in July 2018 and every July back to 2013 in each of the largest 100 metros.
- We assume households stay in their homes for seven years.
- We calculate the initial total monthly costs of owning and renting, including mortgage payments, maintenance, insurance and taxes.
- We calculate the future total monthly costs of owning and renting, taking into account expected price and rent appreciation as well as projected inflation.
- We factor in one-time costs and proceeds, including closing costs, down payment, sale proceeds, and security deposits.
- We calculate net present value, which reveals the opportunity cost of using money to buy a house instead of investing it. Net present value is the worth in today’s dollars of a future stream of payments and proceeds, taking into account expected interest rates.
You can read our extended methodology here.

