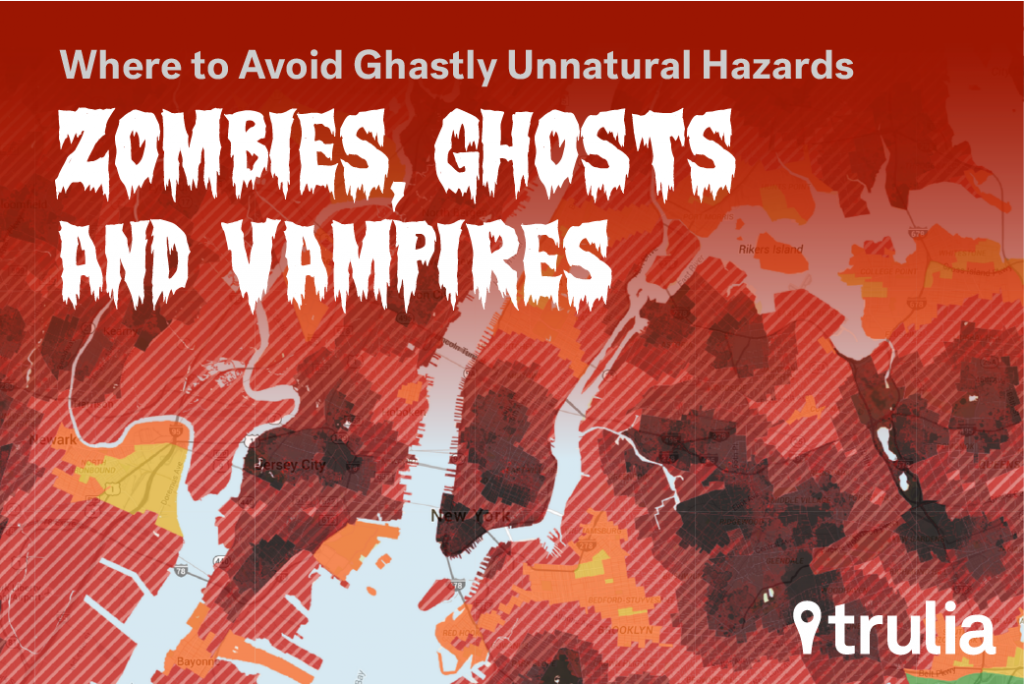
For the month of October, Trulia is bringing back its unnatural hazard maps to help house hunters avoid a close encounter with the undead. Utilizing a combination of logic and paranormal capabilities (learn all about the technical wizardry on Trulia’s Tech & Innovation blog), certain mapping ghouls have created public information maps which delineate areas that have been dominated by three different unnatural hazards: zombies, ghosts, and vampires. But beware! You may find unspeakable sights at every turn (cue foreboding music).
But if you’re a bit of a data geek like us and wanted to know where’s the WORST possible place to live in the very unlikely event of a zombie apocalypse, vampire attack, or ghostly haunting. Here’s what you need to know…
Where to Avoid Bites from the Walking Dead
Call them what you will – zombies, walkers, biters, cold bodies, creepers, dead ones, or roamers – it’s no laughing matter when a dead body becomes reanimated and comes after you with a vengeance. For determining a home’s risk for a zombie infestation, we used cemetery locations from the U.S. Census and mashed it up with OpenStreetMap‘s tagged cemeteries to create a detailed cemetery base map. From these data points, we calculated degrees of risk based on the minimum distance to a cemetery for every block group in the country.
Live near a cemetery? Good luck – especially if you live in Providence, RI. When we looked at all the major urban areas with more than 800,000 victims people, as defined by the Census, we identified the worst places to live in the event of a zombie apocalypse based on the number of cemeteries per 50,000 people. Not surprisingly, Atlanta – home of the Centers for Disease Control (CDC) and epicenter of the zombie outbreak in AMC’s The Walking Dead – made #8 on our list.

| # | Urban Area | Cemeteries Per 50,000 People |
| 1 | Providence, RI-MA | 11.5 |
| 2 | Nashville–Davidson, TN | 8.6 |
| 3 | Hartford, CT | 7.6 |
| 4 | Bridgeport–Stamford CT-NY | 7.2 |
| 5 | Boston, MA-NH-RI | 6.3 |
| 6 | Pittsburgh, PA | 5.5 |
| 7 | Cincinnati, OH-KY-IN | 5.4 |
| 8 | Atlanta, GA | 5.2 |
| 9 | Indianapolis, IN | 5.1 |
| 10 | Cleveland, OH | 4.1 |
Where Vamps Go After Coming Out of the Coffin
Vampires like blood. Shocking right? As such, you can count on hospitals and blood banks nationwide to be a hotbed of vampire activity and you should always be on alert where large amounts of vampire food is readily available. We really hope you don’t get bit, but if you do, you can take solace in the fact that you will now live forever. Only drawback is that you’ll need to find blood to survive.
As such, we built our vampire map based on this basic premise: that vampires will likely congregate in areas where their favorite food (blood) is readily available. In addition to a big population of humans, hospitals and medical centers are a great source of blood – special thanks to our friends at Yelp for the data.
In examining all the major urban areas with more than 800,000 food sources people, as defined by the Census, Trulia has identified the worst places to live if vampires start to walk the earth based on the number of hospitals and blood banks per 50,000 people. If you’re a Twilight fan, you’ll be pleasantly surprised to see Seattle, which is close to Forks, rank #8 on our list. But if you’re more an Anne Rice vampire fan, New Orleans came in at #5.

| # | Urban Area | Blood Banks and Hospitals Per 50,000 People |
| 1 | San Diego CA | 3.2 |
| 2 | Austin TX | 3.0 |
| 3 | San Francisco–Oakland CA | 2.5 |
| 4 | Louisville/Jefferson County KY-IN | 2.4 |
| 5 | New Orleans LA | 2.3 |
| 6 | Oklahoma City OK | 2.3 |
| 7 | Boston, MA-NH-RI | 2.2 |
| 8 | Seattle WA | 2.2 |
| 9 | San Antonio TX | 2.2 |
| 10 | Phoenix–Mesa AZ | 2.2 |
Where Grim Grinning Ghosts Come Out to Socialize
Ghosts are more random in their behavior, but tend to be clustered in haunted places. Yes, we have data for that too. Many… experts have revealed that sightings are most likely to happen in spooky-looking places. So we created an extensive survey to identify the most spooky, and therefore most ghost-infested, places across the country. It was a very scientific survey. And not at all random.
Side note: Don’t zoom in too far on the map or you too will find yourself screaming. You’ve been warned.

| # | Urban Area | Spooky Places Per 50,000 People |
| 1 | New Orleans LA | 1.1 |
| 2 | Seattle WA | 1.0 |
| 3 | Kansas City MO-KS | 0.9 |
| 4 | Providence, RI-MA | 0.9 |
| 5 | Hartford, CT | 0.9 |
| 6 | Portland OR-WA | 0.8 |
| 7 | Salt Lake City–West Valley City UT | 0.8 |
| 8 | Indianapolis IN | 0.8 |
| 9 | Louisville/Jefferson County KY-IN | 0.8 |
| 10 | Baltimore MD | 0.7 |
We hope you enjoy the maps and remember, stay safe from these unnatural hazards during Halloween!


