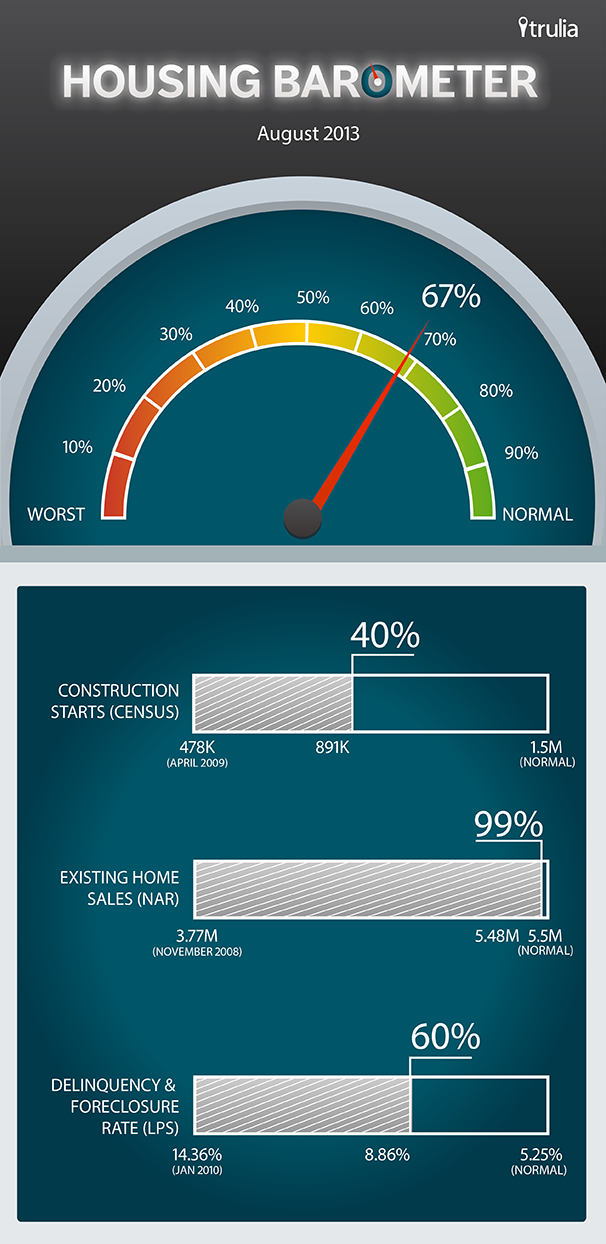
Since February 2012, Trulia’s Housing Barometer has charted how quickly the housing market is moving back to “normal.” We summarize three key housing market indicators: construction starts (Census), existing home sales (NAR), and the delinquency-plus-foreclosure rate (LPS First Look). For each indicator, we compare this month’s data to (1) how bad the numbers got at their worst and (2) their pre-bubble “normal” levels.
In August 2013, all three measures improved: construction starts and existing home sales rose slightly, while the delinquency + foreclosure rate moved strongly downward:
- Construction starts increased a bit, but still far from normal. Starts were at an 891,000 seasonally adjusted annualized rate – up 1% from July and 19% year-over-year. Still, construction starts are 40% of the way back to normal – the slowest recovering measure of Trulia’s Housing Barometer.
- Existing home sales have returned to normal. Sales rose in August to a seasonally adjusted annualized rate of 5.48 million – that’s up 13% year-over-year, and up 29% year-over-year when foreclosures and short sales are excluded. Overall, existing home sales are 99% back to normal, even though foreclosures and short sales still make up roughly one eighth of all existing home sales.
- The delinquency + foreclosure rate continued its downward march. The share of mortgages in delinquency or foreclosure dropped to 8.66% in August, the lowest level in over 5 years. The combined delinquency + foreclosure rate is 60% back to normal.
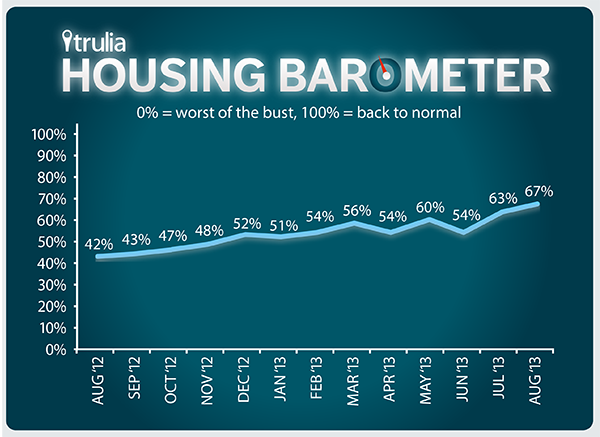
Averaging these three percentages together, the housing market is now 67% back to normal, compared with just 42% one year ago. As the recovery matures, some types of housing activity, like sales and price levels, have returned to near-normal, while others, like construction and household formation, remain far from normal. The housing recovery doesn’t follow a straight line; instead, it moves through phases, with some measures of housing activity returning to normal long before others do.
This blog post marks the retirement of Trulia’s Housing Barometer. When we titled the first Housing Barometer post “Are we there yet?”, the answer was clearly “no.” Now, “are we there yet?” is no longer a yes-or-no question: the answer is yes and no, depending on which aspect of the housing recovery you look at. The recovery is now far enough along that the time has come for a new way to track its progress. We’ll be introducing that new way soon.


