A constant debate in California politics is whether jobs and people are leaving the state. This week, in fact, Texas Governor Rick Perry is in California, trying to lure businesses to his state. He won’t have much luck because jobs rarely move: in a typical year, just 25,000 jobs move out of California, and 16,000 jobs move in, out of an economy of 18 million jobs. In contrast, hundreds of thousands of people move in and out of California each year. Who are they, and why do they move?
Who Moves In and Out?
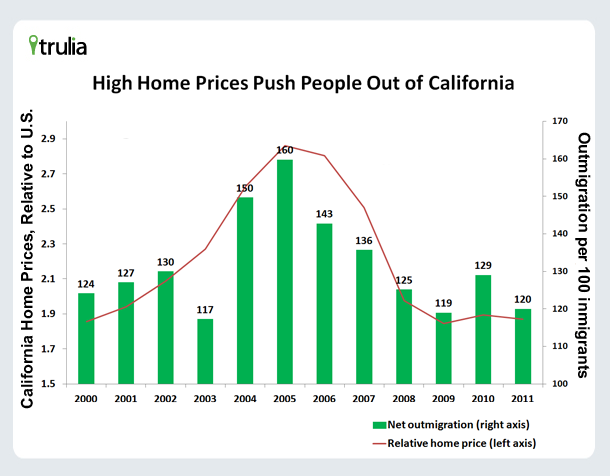
Here are the basic facts. In 2011, 562,000 people left California, and 468,000 came, according to the Census’s American Community Survey. That means 120 people moved out of California for every 100 people who moved in. Out-migration reached its peak in 2005, when 160 people moved out of California for every 100 people who moved in. The California exodus rose with the housing bubble and subsided in the recession. Lower home values in 2008-2011 made California more affordable, encouraging in-migration and discouraging out-migration, as well as pushing some California borrowers underwater, further discouraging out-migration.
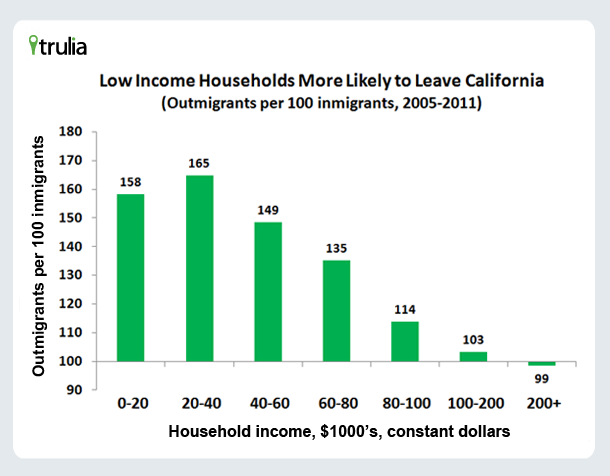
Who leads the charge out of California? Even though California’s richer residents face high tax rates, lower-income households are more likely to leave. From 2005 to 2011, California lost 158 people with household incomes under $20,000 for every 100 who arrived, and 165 for every 100 people with household incomes between $20,000 and $40,000. In contrast, just slightly more people with household incomes in the $100,000-$200,000 range left than came to California (103 out per 100 in), and California actually gained a hair more people in the $200,000+ range than it lost (99 out per 100 in). The rich aren’t leaving California, but the poor and the middle class are.
Where Do Californians Go – and Why?
It’s no coincidence that the Texas governor is visiting California this week and not, say, the Massachusetts governor. Since 2005, far more Californians have turned Texan than the other way around: 183 Californians moved to Texas for every 100 Texans moving to California. (The average flow since 2005 between California and all other states – not just Texas – has been 133 out for each 100 in.) The only states where the flow from California is more lopsided are Oklahoma (212 out per 100 in), Oregon (198), Idaho (190), and Arizona (187). On the other hand, California gains more people from New York, Illinois, Massachusetts than it loses to those states.
Let’s take a closer look at California versus Texas. What does Texas have that Californians want? Cheaper housing, more jobs, and lower taxes.
|
California |
Texas |
|
| Median home price per
square foot, 2012 |
$229 |
$84 |
| Unemployment rate,
December 2012 |
9.8% |
6.1% |
| Total state + local tax burden,
% of income, 2010 |
11.04% |
8.96% |
| Source: Home prices from Trulia; unemployment rate from BLS; tax burden from the Tax Policy Center. | ||
To see which of these factors matter most in explaining why and where Californians move, we teased them apart statistically using regression analysis, looking at movements to and from California in each year since 2005 for each state. All three factors matter, but housing costs matter the most: the exodus from California was strongest when and where the gap in housing costs between California and other states was biggest. This detailed analysis confirms what the above chart showed: outmigration from California was most dramatic in 2004, 2005, and 2006, which were also the years when California home prices were most expensive relative the rest of the country.
Economic Recovery and California Migration
Will more Californians leave as the economy recovers? Probably, yes. The most important factor slowing the out-migration of Californians in 2008 to 2011 was that home prices fell more in California than in the U.S. overall, making California more affordable relative to the rest of the country than during the housing bubble. However, the housing recovery is now lifting home prices in California. According to the Trulia Price Monitor, which tracks asking home prices adjusted for the mix of listed homes, California home prices were up 10.4% year-over-year in January 2013, led by San Jose, Oakland, Riverside–San Bernardino, and Sacramento, well ahead of the national price increase of 5.9%. That means that the gap in home prices between California and the rest of the U.S. is widening once again.
The latest detailed migration data are from 2011, so it’s too soon to see any impact of rising California home prices on migration. But search traffic on Trulia suggests that migration out of California might be gearing up again. The ratio of outbound home searches (by people in California for properties in other states) to inbound searches (by people in other states for properties in California) went up between 2011 and 2012. In 2011, there were 94 outbound searches for every 100 inbound searches; in 2012, there were 99 outbound searches for every 100 inbound searches. Because California has more than its share of luxury and celebrity homes that attract attention, California typically gets more inbound than outbound searches despite having more outbound than inbound migration. But the key here is that the ratio of outbound to inbound searches went up from 2011 to 2012, which is an early leading indicator that outbound migration might be accelerating, too. In short: the home price rebound may be good for California’s homeowners, but it will make California too expensive for many people who would otherwise stay or move here.


