New home construction starts and new home sales are recovering much more slowly than other housing indicators. In August, new home starts and new home sales were 40-50% below normal levels, in contrast with existing home sales, which were just 2% below normal. (By “normal,” we always mean the long-term historical average, not the peak of the bubble, which was anything but normal.) Likewise, Trulia’s latest Bubble Watch reported that prices look just 5% undervalued. What’s holding construction back? The vacancy rate and household formation are two fundamental drivers of construction demand, and both still look weak.
A Brief Soak in the Bathtub of Housing Data
To understand why the vacancy rate and household formation matter for new construction, here’s a simple analogy. Think of the vacant housing stock as water in a bathtub. The bathtub fills when new homes are built. The bathtub drains as vacant homes are occupied, which depends on how fast the overall number of households is increasing – “household formation.” (Side note #1: Newly formed households, who tend to be young, might not be the actual people moving into the newly constructed homes, which tend to be more expensive; rather, this is about aggregate numbers of housing units and households. Side note #2: for simplicity, we’re ignoring the fact that some obsolete vacant homes get demolished.)
When new construction runs ahead of household formation, more water fills the bathtub than drains out – which means the number of vacant homes grows. But when new construction is slower than household formation, the level of the bathwater falls. There’s no magical level of bathwater that’s perfect, but too little water in the tub means a housing shortage, and when the bathtub overfills, that glut of vacant homes might cause a price crash. In the long run, to keep the bathwater from being too high or too low, the “right” level of new construction depends on BOTH the vacancy rate (how full the bathtub is) AND on household formation (how fast the tub is draining).
In the U.S. today, the bathtub is fuller than normal (high vacancy) and is draining slowly (slow household growth). If the faucet were on full force (normal construction levels), our bathtub would soon overflow. Now let’s all towel ourselves dry and look at the two key facts:
1. High vacancy rate means no housing shortage, despite inventory shortage.
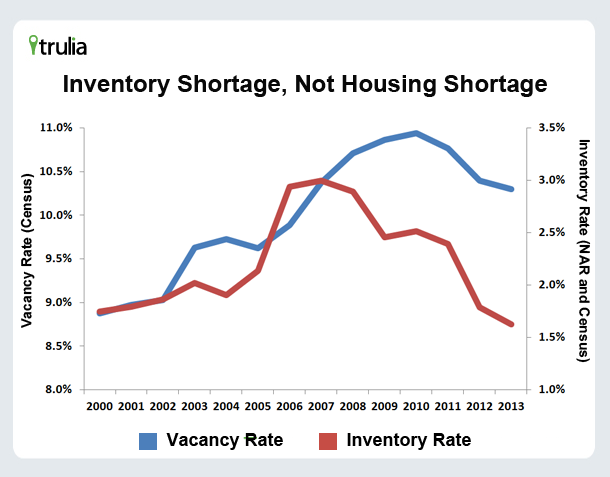
The national vacancy rate in 2013 is above its pre-bubble level. The share of all housing units that stood vacant (year-round vacancies only, not “seasonal” vacancies like beach homes) was 10.3% in 2013 Q2 according to the Census, closer to its high point after the bubble burst (10.9% in 2010) than to its pre-bubble level (8.9% in 2000).
If you’ve been house hunting recently, you’re probably surprised that vacancies are high because relatively few homes are listed for sale. Even though inventory has been recently trending upward a bit, for-sale listings are still well below normal. The share of all for-sale homes each year (based on NAR inventory for June and Census total housing stock for Q2) peaked in 2007 but is now at lowest level since 2000.
That means there’s an inventory shortage, not a housing shortage. Despite the shortage of listed inventory, there are plenty of vacant homes NOT listed for sale. Many of those vacant, off-market homes could come onto the market, especially if their owners are just waiting for prices to rise enough to make selling worthwhile. This graph tells the story:
In short: the vacancy rate – or, the level of the bathwater – is still relatively high.
2. Household growth is slow. Relatively few new households are being formed.
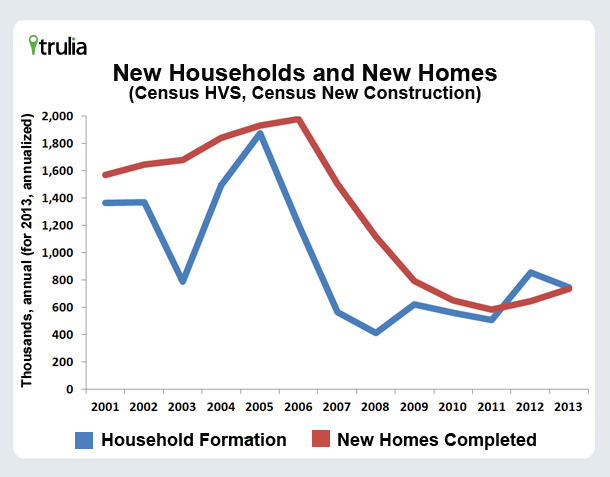
Household formation is lagging. As of 2013 Q2, annual household formation was 746,000 according to the Census, and household formation since 2007 has averaged around 560,000 annually – which is roughly half the normal rate of household formation of 1.1 million (depending on the data source). In most years, new construction and household formation tend to be in sync: water typically flows in through the faucet and out through the drain at a similar rate. But in 2007 and 2008, after the housing bubble burst, there was a sharper drop in household formation than in new construction completions, as this chart shows:
When more water comes in through the faucet than out through the drain – as in 2007 and 2008 – the bathwater level rises. That’s why the vacancy rate increased sharply in those years, as the chart in the previous section showed.
Why is household formation still so low? During the recession, many people doubled up with roommates or lived with relatives, including young adults who stayed in their parents’ homes. Even now, years after the recession technically ended, young adults remain much more likely to live with their parents than before the recession. A big reason why this is happening is that the share of employed young adults is still closer to recession levels than to normal. In total, we estimate there are 2.4 million “missing households” – people of all ages who should be heading up their own households but are instead living with parents, roommates, or others.
In short: household formation is low, so the bath is draining slowly.
Nice story, but is low construction really that simple to explain?
No – it’s not quite as simple as that. Construction activity varies a lot across the U.S., and supply constraints matter too:
- Local construction and vacancies: Each local market is actually its own bathtub. Vacant homes in Detroit can’t house families who live in Los Angeles. In theory, there could be a strong need for construction if economically thriving metros had few vacant homes, and vacant homes were concentrated in economically struggling markets. However, the ten metros with the most elevated vacancy rates today include not just struggling metros like Detroit and Cleveland, but also growing metros like Las Vegas, Tampa, Cape Coral–Fort Myers FL, and Atlanta. (See note.) Even growing metros, therefore, don’t generally have a housing shortage – in part because many of these metros were overbuilt during the bubble.
- Supply constraints: Builders have reported that a lack of buildable lots and other constraints are holding them back. In bathtub terms, a shortage of lots, construction workers, or financing is like a flow restrictor on the faucet. However, because the bathtub level today is high and is draining slowly, builders probably wouldn’t turn the faucet way up even if they could. It’s not that supply constraints don’t matter for housing: on the contrary, geographic features, building regulations, and other supply constraints contribute to the perennial affordability problems in San Francisco, New York, and other cities. But the main reason why national construction today is well below normal is not supply constraints.
There is a strong upside to this bathtime story. Most young adults won’t remain out of work and live in their parents’ basements forever. They represent pent-up demand for housing, which – when unleashed – should push household formation up to and then above its long-term normal rate of approximately 1.1 million annually. That means the bathtub will start draining faster, causing the water level to fall. This will then cue builders to turn up the faucet by building more new homes. And only when that happens might we need to start worrying about a future housing shortage. Until then, let’s be more concerned about missing households than about missing homes.
Note: To estimate the change in vacancy rates by metro, we added together vacancy changes from the Census for 2000-2010, from the American Community Survey for 2010-2011, and from the U.S. Postal Service address file for 2011-2013. This yields the change in vacancy rate between 2000 and 2013. We used multiple sources because no one reports both current and historical metro-level vacancies, and each source defines vacancies differently.
The national household vacancy and household formation data come from the Census’s quarterly Homeownership and Vacancy Survey.


