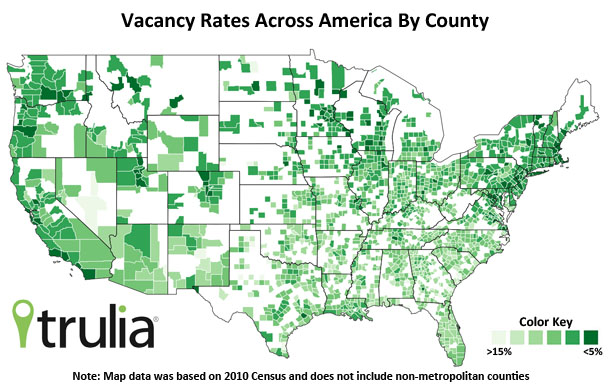
Vacancies are an essential measure of the state of the housing market. Vacant units represent the supply of homes that exceeds demand, and vacancies depress prices and discourage new construction. The effect of vacancies on nearby home prices is strong: one academic study estimates that a vacant home can lower the price of nearby homes within 500 feet by as little as 0.7% and as much as 10% — depending on whether the vacant home is a foreclosure or just neglected.
Today the Census Bureau released its report on housing from the 2010 Census. Because the Census attempts to survey nearly everyone living in the U.S., it lets us see vacancy rates, homeownership levels and other measures for local housing markets. The differences in vacancy rates across metro areas is huge: among the largest metros, the vacancy rate when the Census was conducted in April 2010 ranged from 3.9% in San Jose to 13.9% in New Orleans; the U.S. average is 7.9%.
How are we defining the vacancy rate? It’s the total number of vacant homes divided by all homes that exist in a given area. What we don’t count as “vacant” are vacation homes (i.e., homes that are seasonal, recreational, or occasional-use homes) because they’re not part of the excess housing inventory in the same sense as for sale, for rent or other vacant units are. (In case you were wondering, summertime second-home states like Maine, Vermont, and New Hampshire have the highest share of vacation homes. Florida and Arizona have high shares, too.)
| Top 10 Metros with Lowest Vacancy Rate | ||
| Rank | U.S. Metro | Vacancy Rate |
| 1 | San Jose, CA | 3.9% |
| 2 | Boston, MA | 4.8% |
| 3 | San Diego, CA | 4.9% |
| 4 | Los Angeles, CA | 5.1% |
| 5 | Minneapolis–St. Paul, MN | 5.1% |
| 6 | Portland, OR | 5.3% |
| 7 | Salt Lake City, UT | 5.3% |
| 8 | Hartford, CT | 5.4% |
| 9 | Washington DC | 5.5% |
| 10 | Denver, CO | 5.6% |
| Top 10 Metros with Highest Vacancy Rate | ||
| Rank | U.S. Metro | Vacancy Rate |
| 1 | New Orleans, LA | 13.9% |
| 2 | Las Vegas, NV | 12.3% |
| 3 | Birmingham, AL | 10.5% |
| 4 | Orlando, FL | 10.4% |
| 5 | Memphis, TN | 10.4% |
| 6 | Jacksonville, FL | 10.2% |
| 7 | Detroit, MI | 10.1% |
| 8 | Phoenix, AZ | 10.1% |
| 9 | Cleveland, OH | 10.1% |
| 10 | Tampa–St. Petersburg, FL | 10.0% |
*Among metropolitan areas with at least one million population
The areas with the highest vacancy rates are in the South, Southwest and Midwest, and this includes markets with some of the largest drops in home prices (think Las Vegas, Phoenix and several Florida cities) and longer-term slower growth (such as Detroit and Cleveland). Meanwhile, the continued recovery from Hurricane Katrina has boosted the vacancy rate in New Orleans.
On the other hand, the areas with the lowest vacancy rates include three of the four major California metros – San Jose, San Diego and Los Angeles. The fourth – San Francisco–Oakland – has the 11th lowest, just after Denver, at 5.7%. What’s going on here? Wasn’t California the epicenter of the housing bubble? Yes – but despite the big price declines and high foreclosures in California, there still aren’t enough homes in coastal California for all the people that want to live there, so even with the housing crash, vacancies are among the lowest in the country. Even in the inland California metros of Stockton, Merced and Modesto – the Central Valley cities where home prices fell more than anyplace else in the country – vacancy rates are in the 7-9% range, lower than many big cities in the rest of the country.
Looking across all metropolitan counties, the pattern is clear: vacancy rates are lowest (shaded the darkest green on the map) along the West Coast, Northeast and upper Midwest (Wisconsin and Minnesota), and highest (lightest green) across the South, the rustbelt Midwest (Michigan, Ohio and Indiana), and the Southwest (Nevada and Arizona). Bottom line: Where vacancy rates are low, housing markets will recover sooner and prices will start to rise; areas with high vacancy rates will wait longer for a home price rebound.


