Today’s new numbers on jobs and unemployment in October show how the economy is doing overall. Economic recovery is essential for housing demand to pick up. We track three indicators in the monthly jobs report that matter most for housing to understand whether the recovery in housing demand is underway, approaching, or still far off. These include:
1) Construction job growth
2) Unemployment among 25-34 year-olds
3) Job growth in cities clobbered by the housing bust
Construction job growth
Why does this indicator matter for housing?
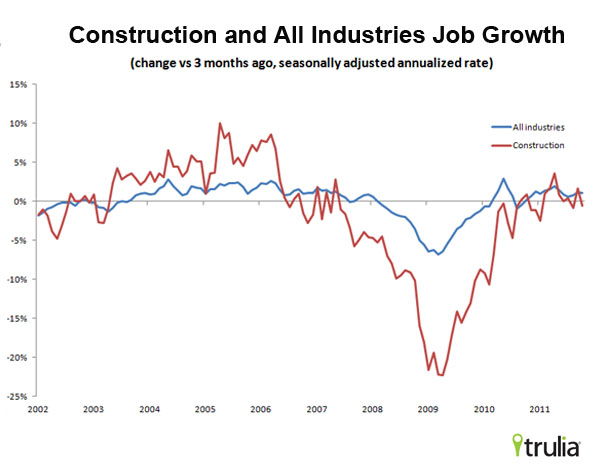
Construction jobs are at the heart of the virtuous or vicious cycle that connects jobs and housing. Housing demand leads to more jobs in construction and related industries, and more jobs means more income and housing demand. Construction job growth is a key indicator of whether this cycle is spiraling downward or spinning upward.
What happened this month?
In October, construction employment fell month-over-month and declined by 0.5% versus 3 months ago (seasonally adjusted annualized rate) and is essentially unchanged from October 2010. Total employment in all industries grew by 1.0% in the last three months. Construction employment growth has not quite caught up to the overall job growth rate, after contracting sharply in 2007-2009 and still lagging behind overall job growth in 2010. Construction jobs in October were 4.2% of total U.S. employment, down from 5.7% at the height of the housing boom below the normal range around 5%. Construction employment still has a lot of catching up to do to get back to its pre-boom share of overall jobs.

Unemployment among 25-34 year-olds
Why does this indicator matter for housing?
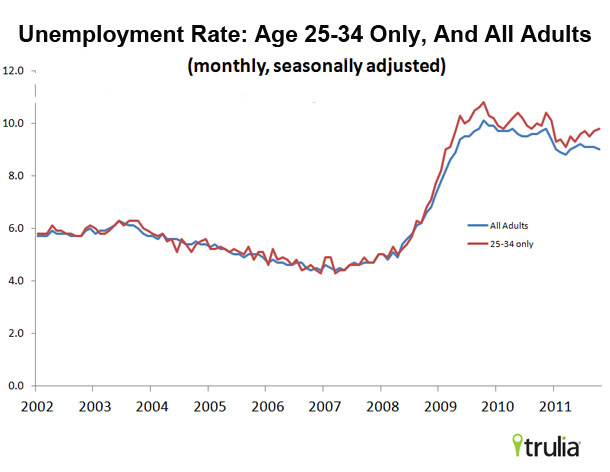
Between the ages of 25 and34 is prime time when many people form households with a spouse, partner, roommate, or by themselves, then start families and buy their first home. During and after the recession, household formation dropped for this age group, and more of them than ever are living with parents or other adults rather than renting or owning their own place. These folks will wait to form their own households and consider homeownership only when their job prospects improve. A key measure for housing demand and homeownership is the unemployment rate for this group and the share of this age group that is employed.
What happened this month?
In October, the unemployment rate for 25-34 year-olds rose to 9.8% from 9.7% in September and is at its highest level since December 2010. The unemployment rate for all adults, in contrast, fell from 9.1% to 9.0%. In October, 73.5% of 25-34 year-olds were employed (the rest are unemployed or not in the labor force because they’re in school, discouraged from looking, or not looking for other reasons), down from 73.7% in September and 73.9% in August. Before and during the boom, almost 80% of this age group was employed. The job market remains tough for this key age group: before the recession, unemployment for 25-34 year-olds followed the overall rate pretty much exactly, but has remained stubbornly above the all-adults rate even as the unemployment rate has drifted down slowly.

Job growth in “clobbered cities”
Why does this indicator matter for housing?
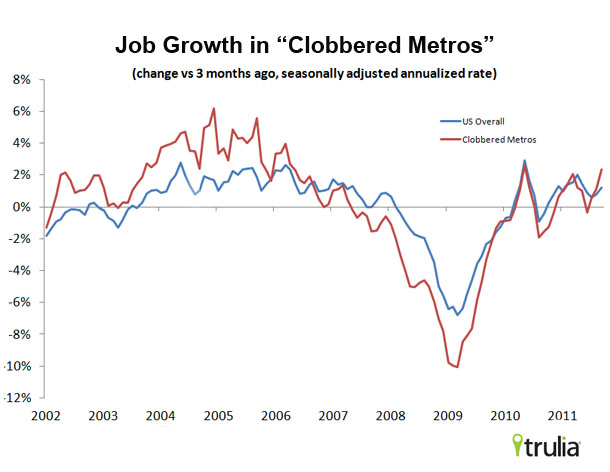
The housing bust had unequal effects nationally, with many local markets in Florida, the Southwest, inland California and Michigan facing some of the largest price declines and highest vacancy rates. Job growth anywhere will boost housing demand, but compared to other places, these clobbered cities are in more desperate need of motivated homebuyers to help their local housing markets recover. We define “clobbered cities” as metro areas where home prices dropped at least 30% during the bust (according to the Federal Housing Finance Agency house price index) and where vacancy rates are still over 7% (excluding seasonal or vacation homes, according to the 2010 Census). Metro-level BLS data are released several weeks after the national data, so this indicator is for the previous month.
What happened this month?
Job growth in clobbered cities grew 2.4% in September relative to three months ago (seasonally adjusted annualized rate). The comparable national figure for September was 0.9%, so these “clobbered cities” had faster job growth than the U.S. overall. That’s a big change from the recession, when job growth in these metros lagged the U.S.
Among these clobbered cities, job growth was especially high in Tucson, Phoenix, Riverside–San Bernardino and Tampa, but other Florida metros – like Jacksonville, Fort Lauderdale and Orlando – lost jobs in the last quarter.
 Links:
—October 2011 BLS Employment Situation Summary
—Additional jobs and unemployment data

