More job openings, and more quitting
The housing market won’t improve until the job market does. Unemployment is creeping down only slowly. But this week had some good job news. Job openings – the number of unfilled positions being advertised – are almost 7% higher than a year ago, which is good news for job seekers. But employers are picky and could be having a hard time finding the right workers. Even though openings are up 7%, they’re advertising for jobs more than they’re hiring: the number of hires rose only 3% in the last year. On the other side of the human resources department, layoffs and firings are down 8% from a year ago, and back to the way things were before the recession.
But workers aren’t returning the loyalty: the number of workers voluntarily quitting is up 10% from a year ago, and up almost 20% from June 2009 when the recession officially ended. They say nobody likes a quitter, but the uptick in quitting might ironically be a sign that people feel confident that they can find a better job or have found one already. Most workers don’t voluntarily quit unless they feel like they have other options. With this glimmer of confidence in the job market, it’s only a matter of time before people start feeling better about the housing market as well.
Link:
—BLS August 2011 Job Openings and Labor Turnover (released 10/12/11):
Volatility: Can you get low-risk high returns?
Like everyone, I’ve been watching the ups and downs of the stock market. Stock prices ratcheted down in early August around the time of the debt ceiling debate in Congress, but volatility shot up and stock prices have been a roller coaster ever since. A good measure of how much the market is bouncing around — the VIX index — has been at its highest sustained level for the last two months since the darkest days of the financial crisis in the fall of 2008. For investors, volatility means risk: investors want to make lots of money with little or no risk. In other words, it’s better to have an investment that dependably returns 5% a year than one that has a 50/50 chance of returning 10% and returning nothing (unless you’re a thrill-seeking gambler).
You should think about home values the same way. Even though home prices aren’t volatile day to day the way the stock market can be, they are over a long period of time. In cities with volatile housing prices, you run the risk of losing all the money you put into your house – everything from your down payment to all the upgrades you made – if you can’t stay put long enough for the market to bounce back up again. Across the US, some markets are a lot bouncier than others. Home prices in Sacramento and Nashville, for instance, both increased around 3.3-3.4% a year on average for the last 25 years. But the similarity ends there. Over those 25 years, Sacramento prices swung big (up or down at least 10%) in 11 of those years, while Nashville prices never did. For the same average return over this period, buying a home in Nashville was a much less risky investment than buying a home in Sacramento. Why does this matter? Well, if you were CERTAIN in 1986 that you would stay put in a home until 2011, then Nashville and Sacramento were equally good bets. But people move all the time, and if you want to minimize the chance that your home will lose value, low volatility matters.
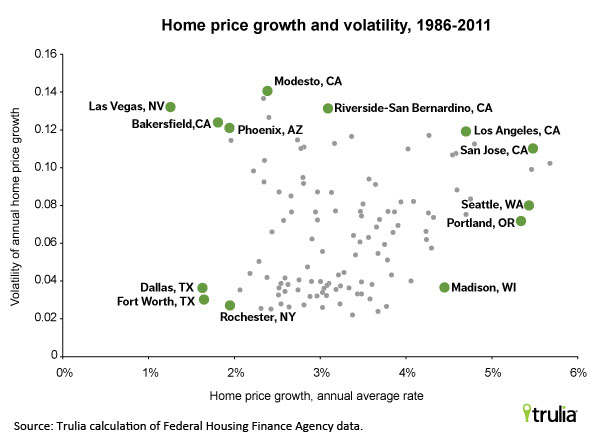
With housing as with any other investment, you want a high return with low risk. But long story short, you can’t have it all. Looking over 25 years, no local real estate market has offered a high return with low risk. Among larger metros, NONE of the top ten metros where prices increased most over time is also in the top ten in low volatility:
| # | Top Metros | Home Price Growth |
| 1 | Honolulu, HI | 5.7% |
| 2 | San Jose, CA | 5.5% |
| 3 | San Francisco, CA | 5.5% |
| 4 | Seattle, WA | 5.4% |
| 5 | Portland, OR-WA | 5.3% |
| 6 | Orange County, CA | 4.8% |
| 7 | Bethesda–Rockville–Frederick, MD | 4.8% |
| 8 | Tacoma, WA | 4.7% |
| 9 | Los Angeles, CA | 4.7% |
| 10 | Washington-Northern Virginia, DC-VA-MD-WV | 4.6% |
(Note: Home price growth is annualized growth rate in home prices, 1986-2011.)
| # | Top Metros | Low Volatility of Growth |
| 1 | Greenville, SC | 0.022 |
| 2 | Pittsburgh, PA | 0.024 |
| 3 | Jackson, MS | 0.025 |
| 4 | Wichita, KS | 0.025 |
| 5 | Omaha, NE-IA | 0.026 |
| 6 | Little Rock, AR | 0.026 |
| 7 | Louisville, KY-IN | 0.026 |
| 8 | Rochester, NY | 0.027 |
| 9 | Indianapolis, IN | 0.028 |
| 10 | Greensboro, NC | 0.028 |
(Note: Volatility is the standard deviation of annual home price changes, 1986-2011. All data from the Federal Housing Finance Agency home price index.)
Among the metros with the highest long-term price growth, Portland OR had the lowest volatility. But Madison WI would have given you still pretty high growth with less volatility – a good place for the risk-averse. But the bottom-right part of the graph – where average growth is high and volatility is low – is pretty empty.
Even though you can’t get high returns with low risk, you could get the worst of all worlds. Over the past 25 years, Las Vegas NV, Bakersfield CA and Phoenix AZ offered low overall price growth with very high volatility. Here’s hoping to a better next quarter-century in those places.


