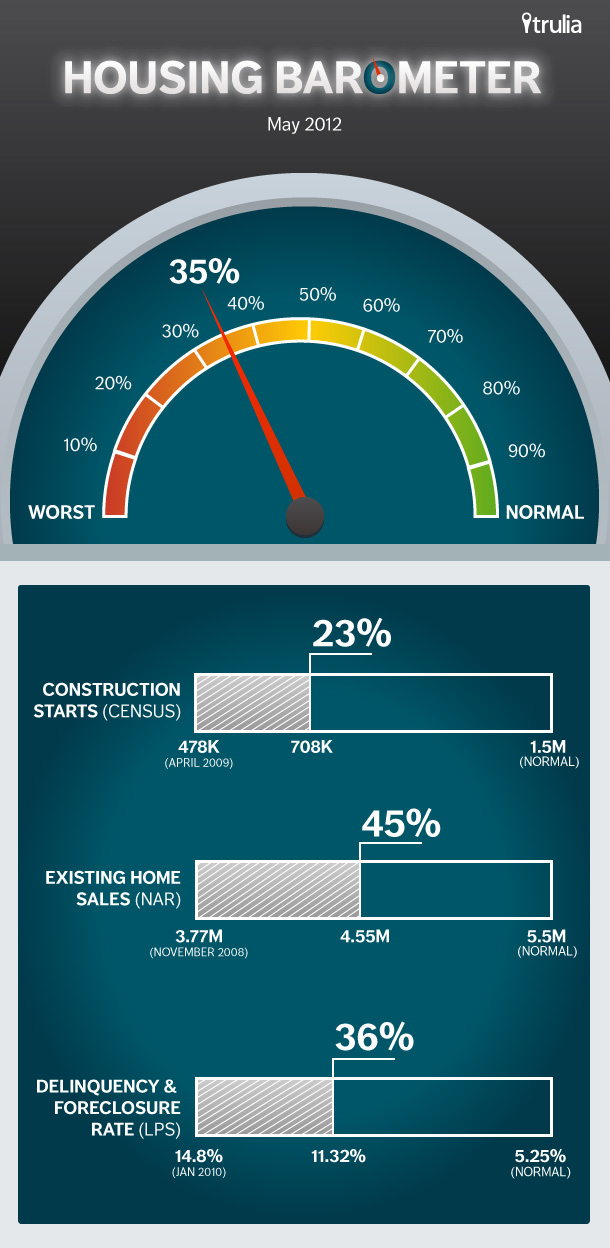
Each month Trulia’s Housing Barometer charts how quickly the housing market is moving back to “normal.” We summarize three key housing market indicators: construction starts (Census), existing-home sales (NAR) and the delinquency-plus-foreclosure rate (LPS First Look). For each indicator, we compare this month’s data to (1) how bad the numbers got at their worst and (2) their pre-bubble “normal” levels.
All three indicators took a step backward in May 2012:
—Construction starts slid back for the month, but up for the year. Starts dropped from an upwardly revised 744,000 in April to 708,000 in May, a 4.8% month-over-month decline. But starts are up 28.5% year over year. Still, construction has a long way to go: starts are just 23% of the way back to normal.
—Existing home sales also decreased. Dropping from 4.62 million in April to 4.55 million in May, home sales are not quite halfway back (45%) to their normal level from their worst point during the bust.
—The delinquency + foreclosure rate ticked upward. (Remember, on this measure, lower is better.) In May, 11.32% of mortgages were delinquent or in foreclosure, inching up from 11.26% in April and 11.23% in March, though down from 12.07% a year ago. The delinquency + foreclosure rate is 36% of the way back to normal, ahead of starts but behind sales.
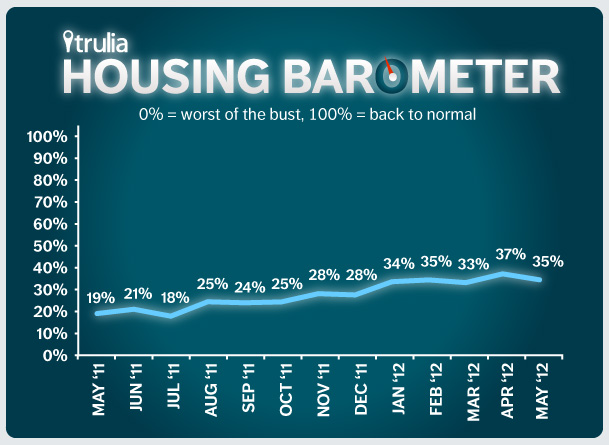
Averaging these three back-to-normal percentages together, the market is now 35% of the way back to normal, compared with just 19% back to normal a year ago. The housing market recovery has hit a plateau, remaining in the 33-37% range since January after making several jumps in the second half of 2011.


