Taking a page from “Back to the Future,” the data geniuses at Trulia have created a never before seen housing study that starts with where people are today and gives you the inside scoop on where they want to live tomorrow. That’s right folks, we’re gazing into the future of housing demand and here’s what we see.
I’m Gonna Move to the Outskirts of Town
True or false – creating more jobs in an area means that more people will want to buy homes in that area. Believe it or not, the answer is false. While having a job will make a prospective homebuyer more willing to settle down, it doesn’t mean he or she will do so in the exact same place where they work.
Let’s face it, city living ain’t cheap and most people would rather get a better bang for their buck when it comes to real estate. Compared to big cities where rents are getting ridiculous and home prices are up the wazoo, suburbia offers cheaper living and a lot of more living space. As we shared in a previous post, 59% of all the home searches on Trulia happen outside a house hunter’s current metro area. Check out these top cross-metro searches…notice how close they all are?
|
Top 10 Cross-Metro Searches |
||
| # | FROM – Where People Are Today: | TO – Where People Want To Move Next: |
| 1 | Los Angeles–Long Beach, CA | Riverside–San Bernardino-Ontario, CA |
| 2 | New York–White Plains, NY-NJ | Long Island, NY |
| 3 | Orange County, CA | Los Angeles–Long Beach, CA |
| 4 | Dallas, TX | Fort Worth, TX |
| 5 | Los Angeles–Long Beach, CA | Orange County, CA |
| 6 | Detroit, MI | Warren–Troy–Farmington Hills, MI |
| 7 | New York–White Plains, NY-NJ | Newark, NJ |
| 8 | Newark, NJ | New York–White Plains, NY-NJ |
| 9 | Warren–Troy–Farmington Hills, MI | Detroit, MI |
| 10 | Washington DC-Northern Virginia | Bethesda–Rockville–Frederick, MD |
But before we move on, a couple of things worth noting here about these cross-metro searches– 56% are for homes where prices have dropped the most since the bust and 63% are for homes in the boonies (err…lower-density, more sprawling areas…to be more accurate).
House Hunters Loving Bargain Bin Homes Right Now
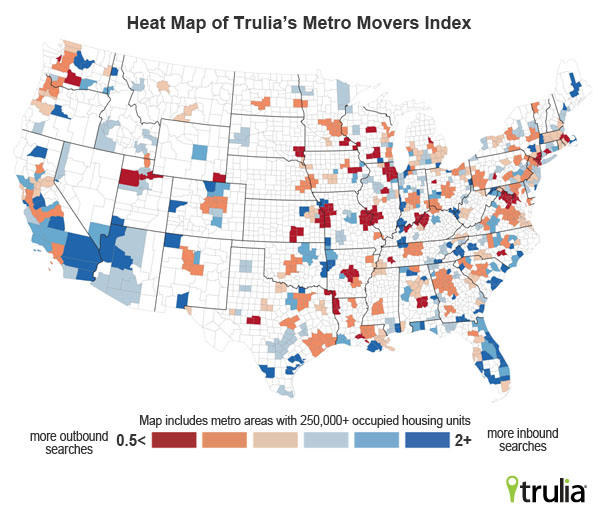
Trulia’s newly-minted Metro Movers Index is a simple way to know where people are looking to move and where they’re not. In a nutshell, we came up with this index by dividing all the house hunting activity by outsiders wanting to move to a metro area by all the house hunting activity by locals wanting to leave a metro. Index scores above 1 means there are more people wanting to move in than leave. Vice-versa, index scores below 1 means there are more people wanting to leave than move in.
To get an idea of which metro area will likely be losing residents and which one will be gaining, check out this heat map. Red means it’s bleeding and things aren’t looking good while blue means it’s the coolest kid on the block and everyone wants to head in that direction.

Now you’re probably wondering – which metro areas came out on top as the most popular and which ones aren’t looking so hot. More likely than not, the former is in Florida and the later is in our nation’s capital.
| Housing Demand Strongest in South and Southwest | ||
| # | U.S. Metropolitan Area | Metro Movers Index |
| 1 | North Port–Bradenton–Sarasota, FL | 6.03 |
| 2 | Riverside–San Bernardino-Ontario, CA | 4.36 |
| 3 | Charleston–North Charleston–Summerville, SC | 2.25 |
| 4 | Fort Lauderdale–Pompano Beach–Deerfield Beach, FL | 2.15 |
| 5 | Cape Coral–Fort Myers, FL | 2.09 |
| 6 | West Palm Beach–Boca Raton–Boynton Beach, FL | 1.99 |
| 7 | Fort Worth–Arlington, TX | 1.97 |
| 8 | Oxnard–Thousand Oaks–Ventura, CA | 1.92 |
| 9 | Las Vegas–Paradise, NV | 1.88 |
| 10 | Orlando–Kissimmee–Sanford, FL | 1.87 |
| Housing Demand Weakest in Northeast and Midwest | ||
| # | U.S. Metropolitan Area | Metro Movers Index |
| 1 | Washington–Arlington–Alexandria, DC-VA-MD-WV | 0.37 |
| 2 | Chicago–Joliet–Naperville, IL | 0.41 |
| 3 | Boston–Quincy, MA | 0.44 |
| 4 | Salt Lake City, UT | 0.44 |
| 5 | Louisville-Jefferson County, KY-IN | 0.45 |
| 6 | St. Louis, MO-IL | 0.46 |
| 7 | New Haven–Milford, CT | 0.47 |
| 8 | Little Rock–North Little Rock–Conway, AR | 0.47 |
| 9 | Kansas City, MO-KS | 0.47 |
| 10 | New York–White Plains–Wayne, NY-NJ | 0.49 |
New Yorkers and Chicagoans Bounded for Sunbelt States
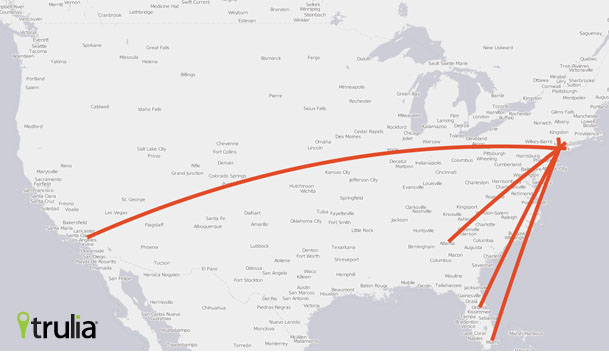
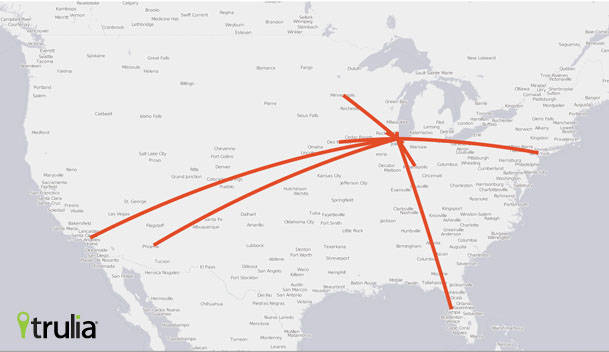
Here’s some good news to the home sellers in the South by Southwest region of the country. Contrary to what you might think, it’s not just a seasonal dream for fun in the sun that’s drawing house hunters from the Northeast and Midwest. In fact, nearly all the top longer-distance homes searches from NYC and Chicago at the end of the summer were to major metros in the South and Southwest. But what’s even more interesting to note is that these searches rarely crossed paths.
New Yorkers preferred homes along the Atlantic coast of Florida, including Miami, West Palm Beach and Fort Lauderdale.

| # | Top Longer-Distance Outbound Searches From NYC |
| 1 | Los Angeles–Long Beach–Glendale, CA |
| 2 | Miami–Miami Beach–Kendall, FL |
| 3 | Orlando–Kissimmee–Sanford, FL |
| 4 | Atlanta–Sandy Springs–Marietta, GA |
| 5 | West Palm Beach–Boca Raton–Boynton Beach, FL |
| 6 | Fort Lauderdale–Pompano Beach–Deerfield Beach, FL |
| 7 | Tampa–St. Petersburg–Clearwater, FL |
| 8 | Chicago–Joliet–Naperville, IL |
| 9 | San Francisco–San Mateo–Redwood City, CA |
| 10 | Charlotte–Gastonia–Rock Hill, NC-SC |
Meanwhile, Chicagoans have a thing for Florida metros along the Gulf Coast in Tampa and Cape Coral as well as metro areas in Texas, Arizona and Nevada.

| # | Top Longer-Distance Outbound Searches From Chicago |
| 1 | Phoenix–Mesa-Glendale, AZ |
| 2 | Los Angeles–Long Beach–Glendale, CA |
| 3 | New York–White Plains–Wayne, NY-NJ |
| 4 | Tampa–St. Petersburg–Clearwater, FL |
| 5 | Atlanta–Sandy Springs–Marietta, GA |
| 6 | Cape Coral–Fort Myers, FL |
| 7 | Dallas–Plano–Irving, TX |
| 8 | Houston–Sugarland–Baytown, TX |
| 9 | Las Vegas–Paradise, NV |
| 10 | Orlando–Kissimmee–Sanford, FL |
To check out the full report, click through the SlideShare deck below.

