Due to a data calculation error, this post has been updated to reflect the following changes: the wage increase for individuals in Super Tuesday states between Q4 2011 and Q2 2015 is 8.9%. The change during the same period for non-Super Tuesday states is 8%. Individual income, measured as a weighted four-quarter rolling average, for workers in Super Tuesday states was $52,026 as of June 30, 2015 and $52,000 for non-voting states and D.C.
On March 1, Alabama, Arkansas, Georgia, Massachusetts, Oklahoma, Tennessee, Texas, Virginia and Vermont will be holding primaries, while Alaska, Colorado and Minnesota will be holding party caucuses. Because of the sheer size and geographic diversity of these states, the collection of 12 primaries and caucuses that are held on the first Tuesday in March is considered the broadest and most representative of all primary season contest dates.
More than half – 632 of 1,237 — of the delegates needed to win the Republican presidential nomination and nearly half — 1,007 of 2,383 — of the Democratic delegates needed to win the nomination will be up for grabs that day. How these voters have fared economically under President Obama may have an impact on how they vote.
Looking at some key measures, we wanted to see if these Super Tuesday states are better off than they were four years ago, especially in the realm of home ownership, and how these states compared to the rest of the nation. Turns out, if you live in a Super Tuesday state, chances are that when it comes to housing and your ability to afford it; you are.
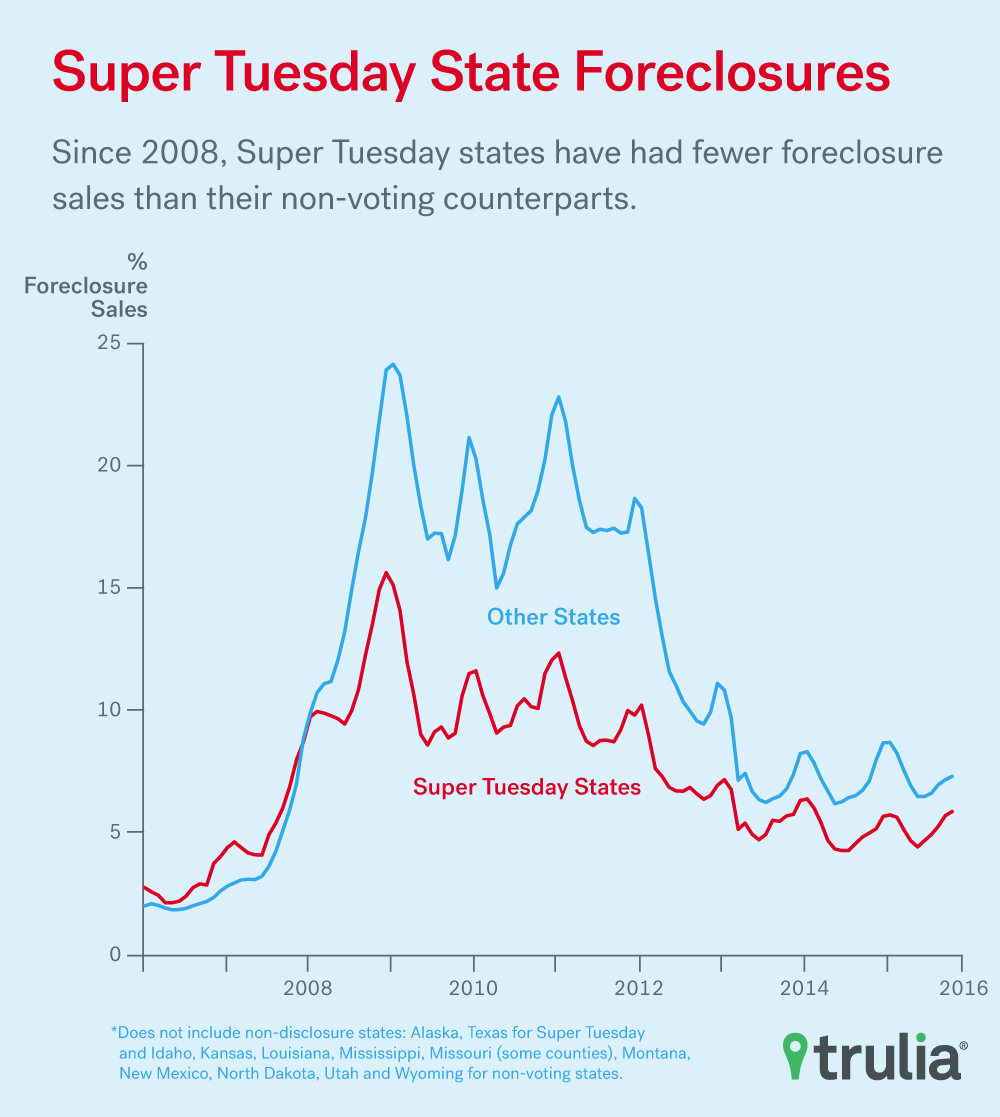
- Super Tuesday states were less affected by the housing crisis when measuring monthly foreclosure sales rates. The states voting March 1 saw roughly half as many foreclosure sales – as a percentage of all sales – between 2008 and 2012 than non-voting states.
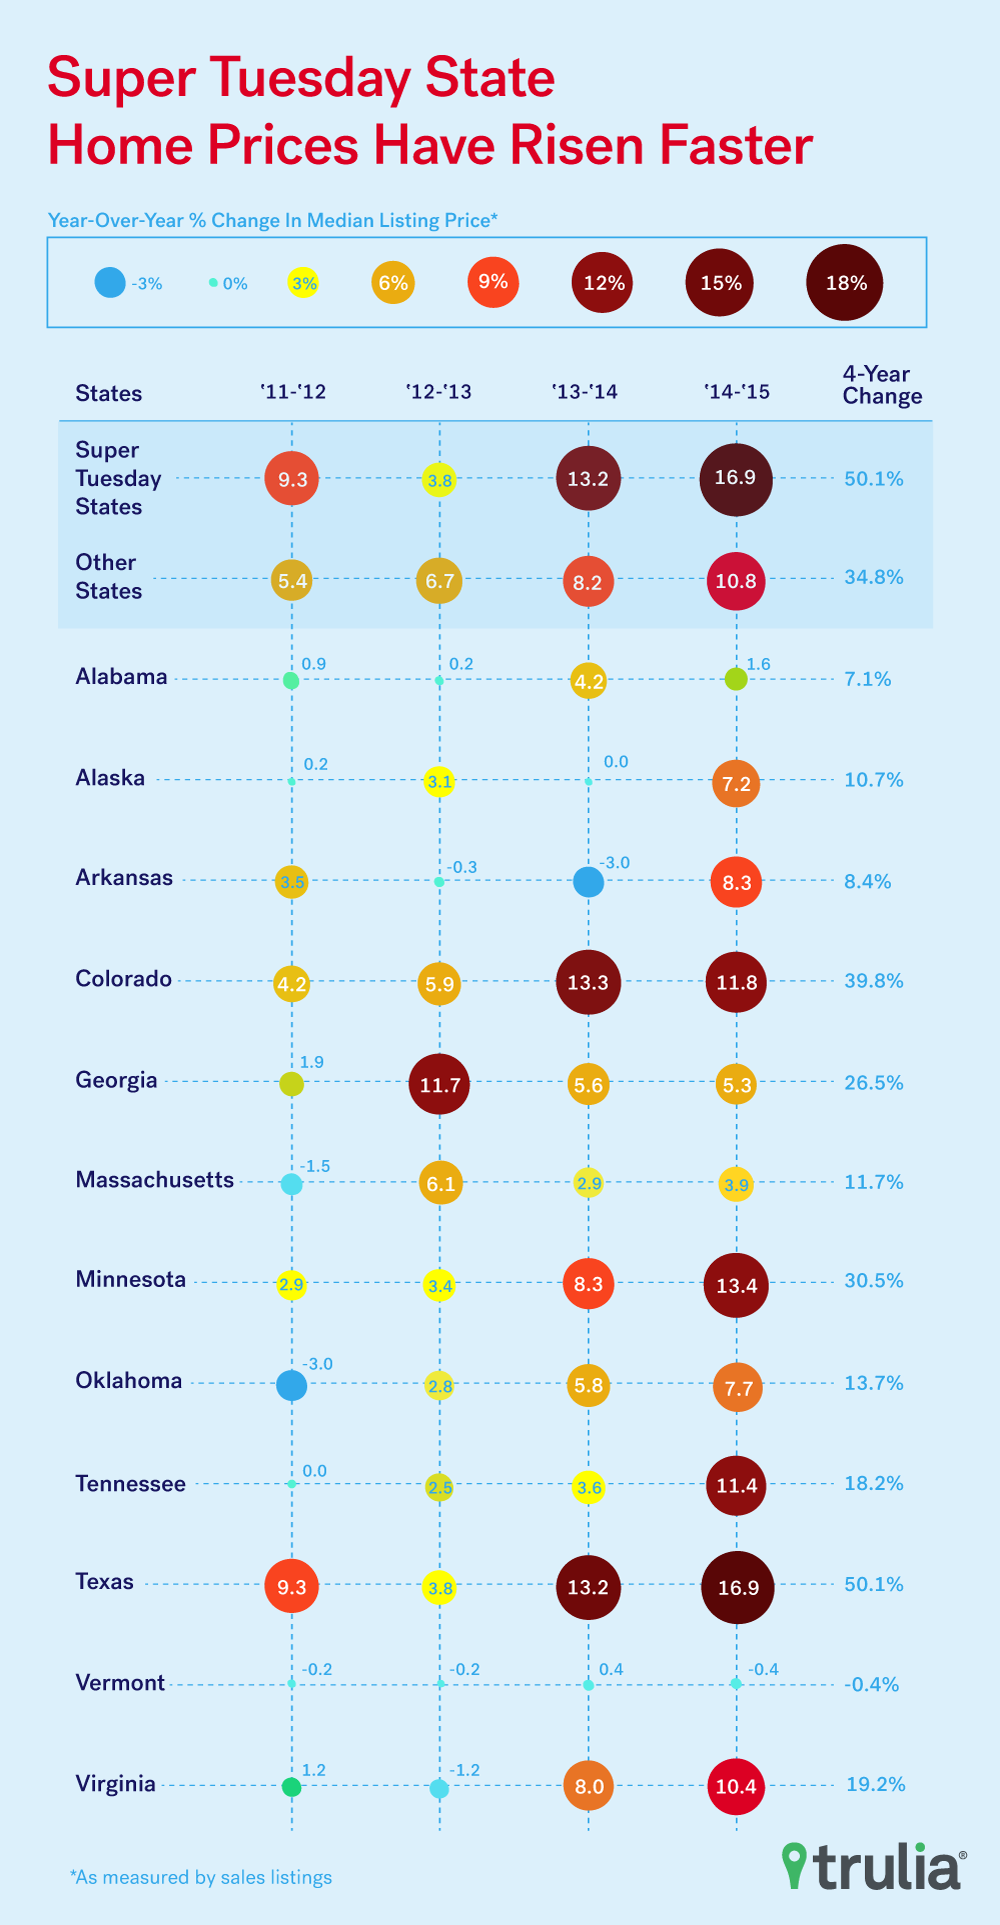
- The median listed home price in Super Tuesday states has risen 50.1%, during the last four years and now is worth 7.7% more than the median home in non-voting states – the Super Tuesday median home was worth 2.8% less in 2011.
- Some Super Tuesday states lag the nation when it comes to a housing recovery. The median home price in Vermont has slipped 0.4% in the last five years. Median home prices in Alabama, up 7.1% and Arkansas, up 8.4%, fall below the double-digit gains seen nationally among all Super Tuesday states. But some Super Tuesday states have seen a dramatic housing recovery. The median house price in Texas is up 50.1% in the last five years and up 39.9% in Colorado.
We also found Super Tuesday states were more stable when it came to creating jobs, saw better wage growth and when it came to home prices, saw a recovery that valued the median Super Tuesday home at a higher level than the rest of the country.
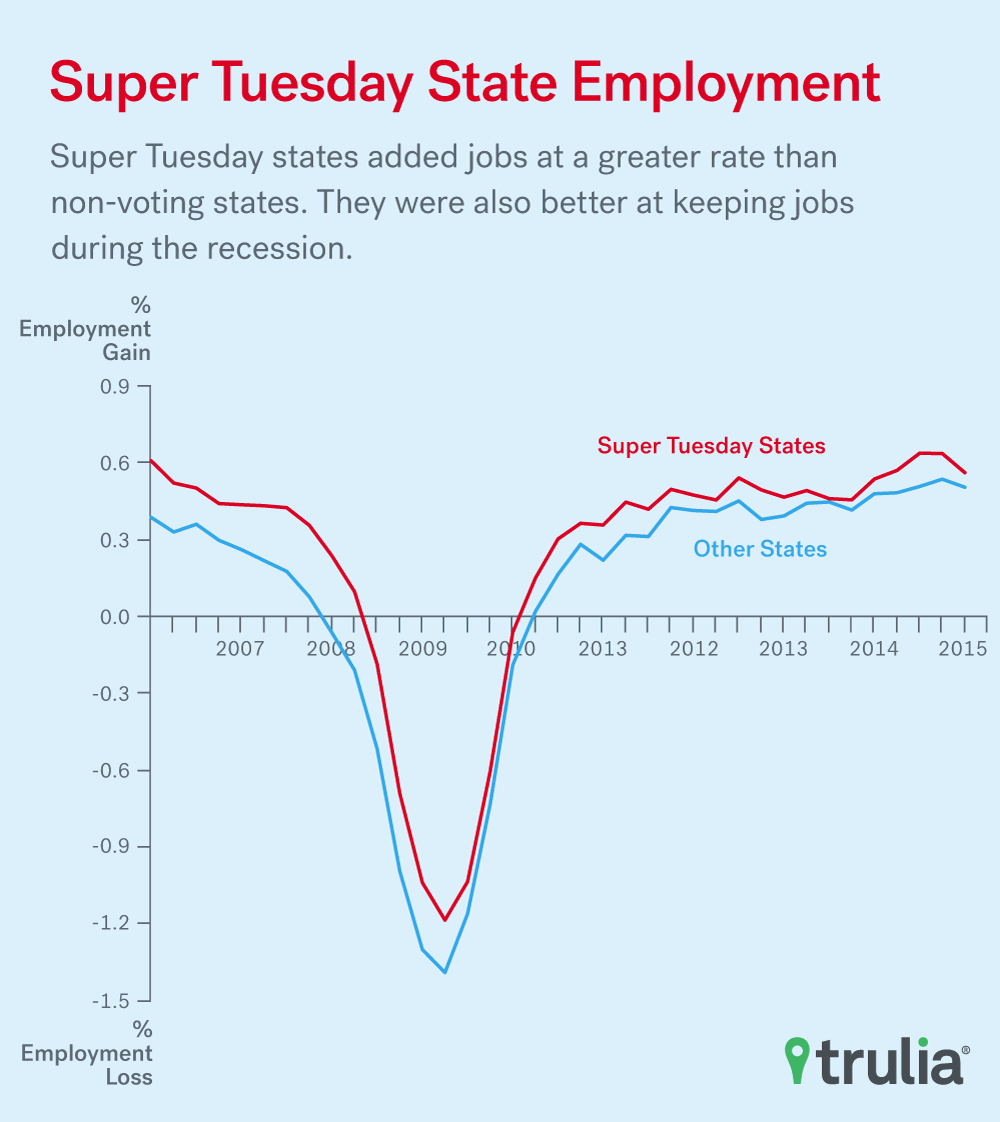
- States voting March 1 also were more likely to add jobs in the recovery and less likely to lose them in the recession. Super Tuesday states added 2.88 million jobs during the last decade, an increase of 8.7%. The other 38 states and District of Columbia added 2.96 million jobs, just a 3% increase.
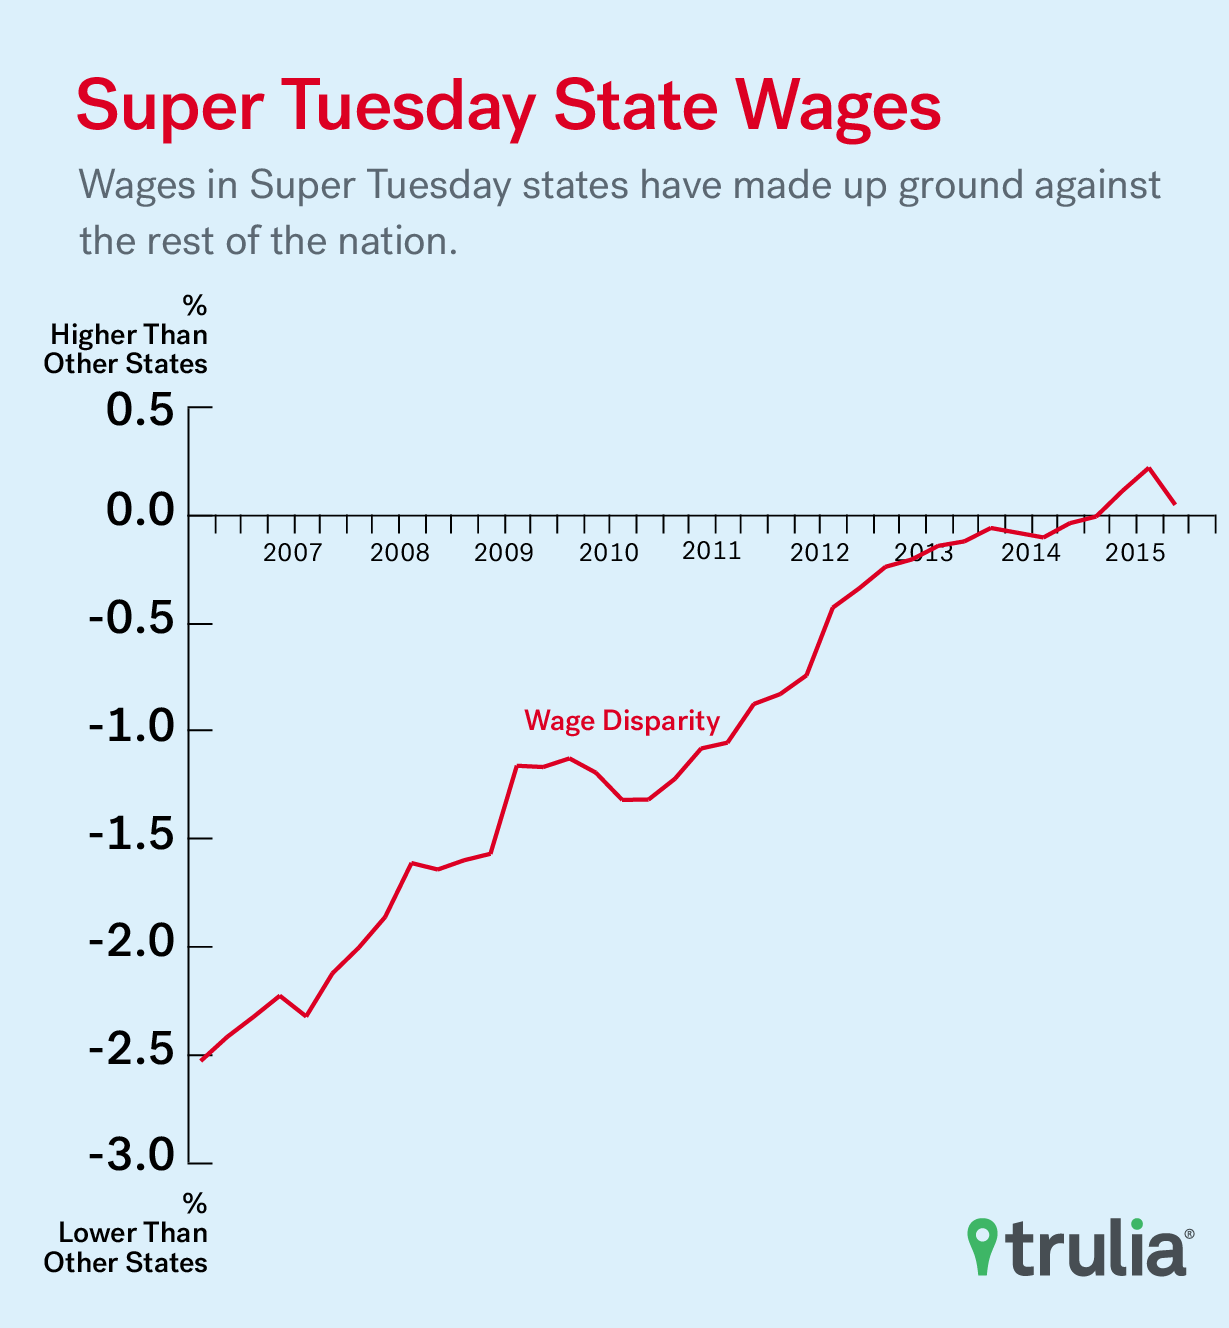
- Wages in Super Tuesday states are growing at a faster rate. The average Super Tuesday individual made roughly the same as workers in non-Super Tuesday states did last year, but have seen a nearly 2.5 percentage-point swing from 10 years ago.
- No surprise then that population in Super Tuesday states is growing faster than the rest of the nation. Those states have 83.5 million residents, 25.9% of the nation’s population and have added 5.6% to their combined total since 2010, compared to 3.3% growth in the other 38 states and District of Columbia.
So as candidates from across the political spectrum fan out to make their last-minute appeals, they may want to consider that while Super Tuesday states are a big slice of America, they’re also doing a little bit better than the rest of the nation.
Housing Prices and the Foreclosures
Since 2008, Super Tuesday states have had fewer foreclosures than their non-voting counterparts. The one exception: Colorado where foreclosure sales as a percentage of all sales was above 20% for 21 months and peaked at 24.1% of all sales the third quarter of 2008. By contrast, the percentage of foreclosure sales during roughly the same time was 9.8% to 12.1% for Super Tuesday states and 14.7% to 17.7%for non-Super Tuesday states.
Four of the 12 states helped Super Tuesday states beat out the rest of the nation when it came to median listing prices, our measure of home prices. Massachusetts ($374,000), Colorado ($362,110), Virginia ($297,995) and Texas ($270,000) all had median listing prices in 2015 that beat the rest of the nation’s median: $249,250. Price surges in those states – especially Colorado where listing prices rose 39.8% from 2011 to 2015 – helped Super Tuesday collectively beat the rest of the country with an average median premium of 7.7% to the rest of the country.
| Median Listing Price | ||||||
| 2011 | 2012 | 2013 | 2014 | 2015 | 4-Year Change | |
| Other States and D.C. | $184,900 | $194,873 | $207,990 | $225,000 | $249,250 | 34.8% |
| Super Tuesday States | $179,900 | $196,586 | $203,995 | $230,990 | $270,000 | 50.1% |
| Premium/Discount (Y-o-Y % Change) | -2.8% | 0.9% | -2.0% | 2.6% | 7.7% | |
Jobs and Wages
Individual income, measured as a weighted four-quarter rolling average, for workers in Super Tuesday states was $52,026, as of June 30, 2015. That’s roughly even with the $52,000 average in other states and D.C. Wages in Super Tuesday states have been rising at a faster rate than the rest of the nation since 2007. Massachusetts leads Super Tuesday states with an average income of $65,390.
During the last decade, this year’s Super Tuesday states added jobs at a greater rate, 8.7%, than non-voting states, 3%, before the recession and after. They were also better at keeping jobs during the recession. At no point between 2006 and 2015 did the 38 other states show better job growth than Super Tuesday states.
So, what does this mean when March 1 results are tallied? Ultimately, Super Tuesday results generally come from states that have generally stronger economies and housing markets than the rest of the nation. Issues such as immigration’s effect on wages and jobs, income inequality and other pocketbook issues may not resonate as deeply in states where the economy is generally stronger than the rest of the country.
| Growth/Loss For Super Tuesday States (2011 Q4 to2015 Q2) | ||||
| Wage Gain/Loss(% Change) | Home Listing Price Gain/Loss(% Change) | Employment Gain/Loss(% Change) | Foreclosure Sales Average* | |
| Alabama | 6.1% | 7.1% | 3.5% | 6.9% |
| Alaska | 9.6% | 10.7% | 2.9% | N/A |
| Arkansas | 7.9% | 8.4% | 2.4% | 3.9% |
| Colorado | 8.8% | 39.8% | 11.2% | 10.1% |
| Georgia | 7.9% | 26.5% | 8.1% | N/A |
| Massachusetts | 9.6% | 11.7% | 6.2% | 4.6% |
| Minnesota | 9.8% | 30.5% | 5.8% | 10.6% |
| Oklahoma | 9.9% | 13.6% | 5.6% | 2.1% |
| Tennessee | 7.6% | 18.2% | 6.9% | N/A |
| Texas | 10.3% | 50.1% | 10.7% | N/A |
| Vermont | 7.9% | -0.4% | 3.5% | 1.5% |
| Virginia | 5.6% | 19.2% | 2.9% | 5.9% |
| All Super Tuesday States | 8.9% | 50.1% | 7.5% | 6.6% |
| Other Non-Super Tuesday States, including Washington DC | 8.0% | 34.8% | 6.4% | 10.8% |
| * As a percentage of all sales | ||||
Methodology
Employment and wage statistics from 2006 to 2015 were provided by the most recent U.S. Bureau of Labor Statistics Quarterly Census of Employment and Wages (QCEW) report. We used a four-quarter rolling average of average quarterly employment and four-quarter rolling average of wages (weighted by employment) to adjust for seasonality. We grouped Super Tuesday states and states not voting March 1 separately.
To determine home prices, we used Trulia listing prices excluding foreclosures. Findings are based on median listing prices for each state and the median of all listings in Super Tuesday states vs. the 38 other states including the District of Columbia.
Foreclosure information is weighted by the number of sales and based off of an internal public records database of home sales. In addition to excluding non-disclosure sates, Maine, Rhode Island, Vermont, West Virginia, and South Dakota were also excluded due to quality issues.
Non-disclosure states include: Alaska, Idaho, Kansas, Louisiana, Mississippi, Missouri (some counties), Montana, New Mexico, North Dakota, Texas, Utah, and Wyoming.
Population information came from the U.S. Census Bureau latest population estimates.

