
Ever-rising prices for homes combined with flat or lower rents are changing the rent vs. buy equation in America’s biggest housing markets.
While it’s still a better deal to buy, the economic benefit has narrowed to the point that in some places, for some households, the decision to rent or buy a home may be too close to call. To calculate the financial cost of renting versus buying we assume that households stay in their home for seven years and can afford to put 20% down and a 30-year fixed rate mortgage when buying a home.
Under those conditions, the truth is that it is still cheaper to buy than rent in all of the 100 biggest U.S. metro areas, but that gap has dwindled recently as price growth outpaces rent growth. And in some markets small changes – a higher interest rate, less money down or a neighborhood’s characteristics – may make a rent vs. buy decision too close to call. Here are the key findings:
- It is still cheaper to buy than rent across the biggest 100 metros, ranging from just over 50% cheaper to buy than rent in Baton Rouge, La. to a mere 3.5% cheaper in San Jose, Calif.
- But, the financial advantage of buying versus renting has decreased in all of the 100 biggest metros from the same time last year due to the fact that mortgage rates have increased slightly, rent price growth has slowed or hasn’t changed in 93 metros, and home values have increased in all 100 metros.
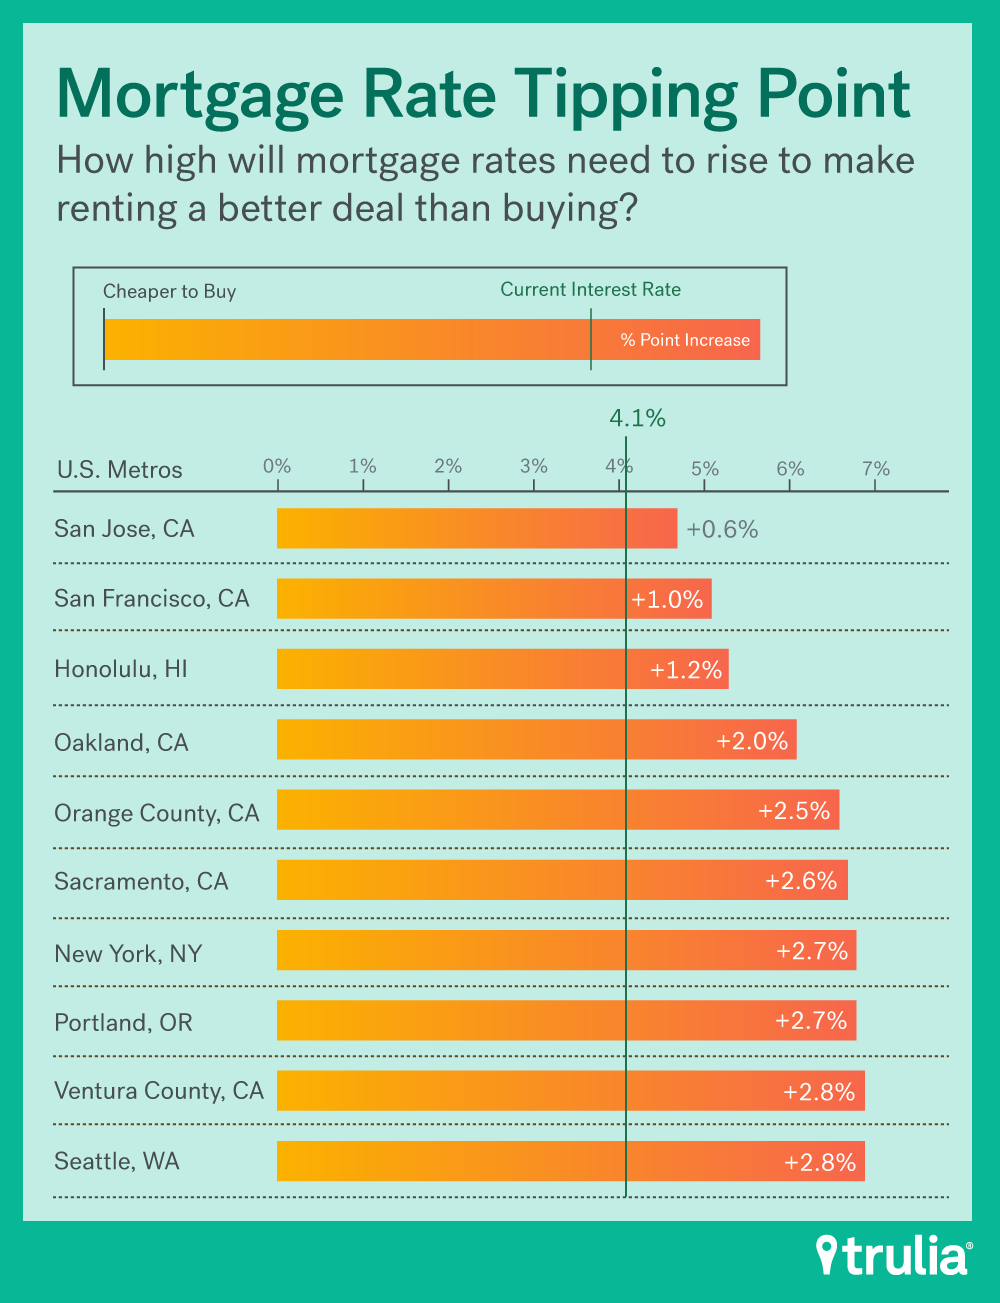
- It soon could be cheaper to rent in San Jose (if interest rates rise to 4.7%), San Francisco (5.1%), and Honolulu (5.3%).
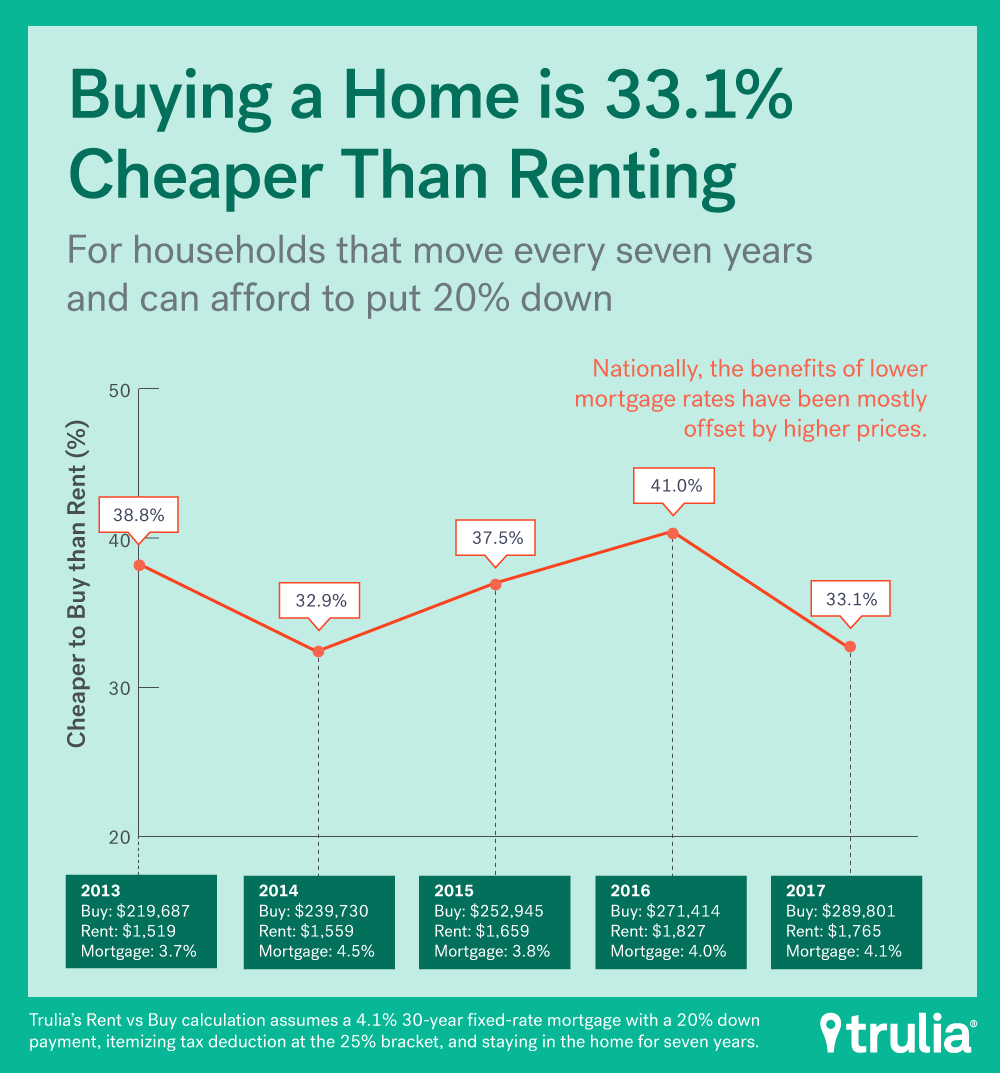
Nationally, home prices have been tracking steadily higher over the past four years. While rents also increased from spring 2013 to spring 2016 before reversing course and declining 3.5% from spring 2016 to spring 2017. With rents and home values previously moving in tandem, shifts in the rent versus buy decision were largely driven by changes in mortgage interest rates.
Mortgage interest rates have fluctuated over the past four years, and the times when the rent versus buy margin change has not followed suit was when home price growth outpaced rent growth. In spring of 2014, mortgage rates climbed to 4.5%, but even though rates have fallen, the advantages of buying haven’t greatly improved. Why? Rents rose only 2.6% compared to homes prices rising 9.1%. Similarly, this spring sees a slight increase in mortgage interest rates but a significant decline in savings from buying than renting as rents decreased while home prices increased.
| Q2 2013 | Q2 2014 | Q2 2015 | Q2 2016 | Q2 2017 | |
| National Median Home Value | $219,687 | $239,730 | $252,945 | $271,414 | $289,801 |
| National Median Rent | $1,519 | $1,559 | $1,659 | $1,828 | $1,765 |
| Mortgage Rate | 3.7% | 4.5% | 3.8% | 4.0% | 4.1% |
| % Cheaper to Buy Than Rent | 38.8% | 32.9% | 37.5% | 41.0% | 33.1% |
| *National figures are calculated using a weighted average of the largest 100 metros using the number of occupied housing units in each metro. | |||||
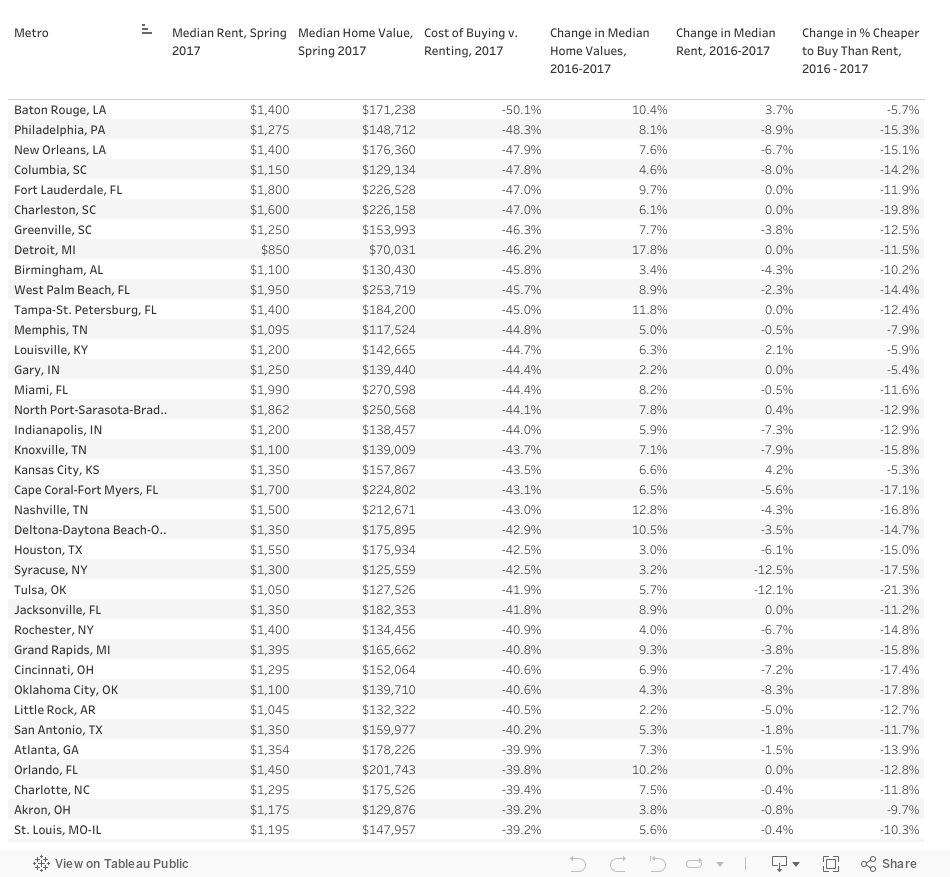
Renters looking to stay in one place for at least seven years and have saved enough for a 20% down payment should not hesitate to buy in metros in the South such as Baton Rouge, La., New Orleans, La., or Columbia, S.C. Additionally, Detroit and Philadelphia are also markets where buying far outweighs renting. Here, home seekers find it at least 45% cheaper to buy than rent.
| Where Buying Nets a Better Deal Than Renting | |||
| U.S. Metro | Median Price | Median Rent | % Cheaper to Buy Than Rent, Spring 2017 |
| Baton Rouge, LA | $171,238 | $1,400 | -50.1% |
| Philadelphia, PA | $148,712 | $1,275 | -48.3% |
| New Orleans, LA | $176,360 | $1,400 | -47.9% |
| Columbia, SC | $129,134 | $1,150 | -47.8% |
| Fort Lauderdale, FL | $226,528 | $1,800 | -47.0% |
| Charleston, SC | $226,158 | $1,600 | -47.0% |
| Greenville, SC | $153,993 | $1,250 | -46.3% |
| Detroit, MI | $70,031 | $850 | -46.2% |
| Birmingham, AL | $130,430 | $1,100 | -45.8% |
| West Palm Beach, FL | $253,719 | $1,950 | -45.7% |
| Note: Among 100 largest U.S. metros. A negative percentage means homeownership is cheaper than renting. For example, it’s 50.1% cheaper to buy a home than to rent in Baton Rouge. | |||
Buying is less of a deal in metros that frequently appear on the lists of least affordable or most expensive places to live. These places are concentrated on in California, Hawaii, and the Tri-State area (N.Y., N.J. and Conn.). The margin between renting and buying in San Jose, San Francisco, and Honolulu dipped into the single digits for the first time in the last four years.
| Where Buying Outweighs Renting by the Slimmest Margins | |||
| U.S. Metro | Median Price | Median Rent | % Cheaper to Buy Than Rent, Spring 2017 |
| San Jose, CA | $977,918 | $3,500 | -3.5% |
| San Francisco, CA | $1,142,164 | $4,100 | -8.0% |
| Urban Honolulu, HI | $657,762 | $2,500 | -9.9% |
| Oakland, CA | $682,641 | $2,950 | -17.2% |
| Orange County, CA | $671,311 | $3,000 | -21.1% |
| New York, NY | $431,079 | $2,300 | -21.6% |
| Portland, OR | $358,812 | $1,850 | -22.0% |
| Sacramento, CA | $359,945 | $1,795 | -22.3% |
| Ventura County, CA | $547,294 | $2,650 | -22.9% |
| Newark, NJ | $341,079 | $2,200 | -22.9% |
| Note: Among 100 largest U.S. metros. A negative percentage means homeownership is cheaper than renting. For example, it’s 3.5% cheaper to buy a home than to rent in San Jose. | |||
The tipping point at which mortgage rates must rise to make buying an equal financial proposition to renting is closest in West Coast cities and New York. Seven of the 10 cities with the closest margins are located in California, with San Jose and San Francisco topping both this list as well as the list for most expensive metros. In fact, all 10 of these metros also hold spots in the top 20 most expensive metros.
Rents fell or were unchanged in nearly all markets from a year ago, except for seven. The markets with the largest rent increases included Albuquerque, N.M., (8.2%), Kansas City, Mo. (4.2%), Omaha, Neb. (3.8%), and Baton Rouge, La. (3.7%). Meanwhile, home values increased in all 100 metros. The cost of buying over renting dropped in all 100 metros. So despite the fact that the Federal Reserve Bank’s Federal Open Market Committee (FOMC) raised rates twice since December, the impact on mortgage interest rates has been slight. Another potential policy change that may impact the financial advantage of buying is the Trump administration’s proposed tax policy. By raising the standard deduction, this policy would erode the financial advantage of buying. See Trulia’s recent report here. Moreover, if home values continue to outpace rent then the concern of homeownership being better financial decision hangs on how much home values increase for these metros.
Methodology
The following outlines how Trulia calculates the costs of buying and renting:
- We use our quality-adjusted measure of home prices and rents, which allows an apples-to-apples comparison between rental and owner-occupied housing units. We looked at median home value and rent in April 2017 in each of the largest 100 metros.
- We calculate the initial total monthly costs of owning and renting, including mortgage payments, maintenance, insurance, and taxes.
- We calculate the future total monthly costs of owning and renting, taking into account expected price and rent appreciation, as well as projected inflation.
- We factor in one-time costs and proceeds, including closing costs, down payment, sale proceeds, and security deposits.
- We calculate net present value, which reveals the opportunity cost of using money to buy a house instead of investing it. Net present value is the worth in today’s dollars of a future stream of payments and proceeds, taking into account expected interest rates.
Trulia’s Rent vs. Buy Calculator lets you compare renting and buying costs using other assumptions about prices, rents, and other factors. It uses the same math that powers our interactive map and this report. You can read our extended methodology here.

