
Editor’s note: An earlier version of this report misstated the median list price of homes in Napa County. The report has been corrected.
As communities in Northern California recover and rebuild from the devastating, fatal fires that swept through five months ago, the area’s housing-market has become even more competitive: residents are looking to stay – and many would-be residents are looking to move in.
Trulia examined data from the region – everything from prices, to listings, and search data – to find out how the fires changed the housing market. Many of our findings suggest a market disrupted by a massive natural disaster. The number of lots for sale jumped, while the number of homes for sale fell sharply.
But two data points suggest residents and those from outside the area want to live there. First, though residents of fire-torn Sonoma and Napa counties are searching outside the area at a greater rate than they did a year ago, most residents still are looking close to home. Santa Rosa, Calif. ZIP codes make up the top five ZIP codes searched from inside the area.
Second, prices for homes have increased. While it’s clear that prices, in part, have risen on decreased supply – nearly 9,000 structures were lost in Sonoma and Napa counties – there remains strong demand to live in the area. Notably, much of this demand is coming from the San Francisco and Oakland areas, where home prices are the highest in the country.
Among our findings:
- In Santa Rosa, empty-lot listings jumped 235% to 231 in March, up from 69 the same period a year ago. And, during the same period, listings with single-family homes fell 16.6% to 267 from 320. In Napa County, empty lot listings have risen 6.9% and single-family home listings fell 22.2%.
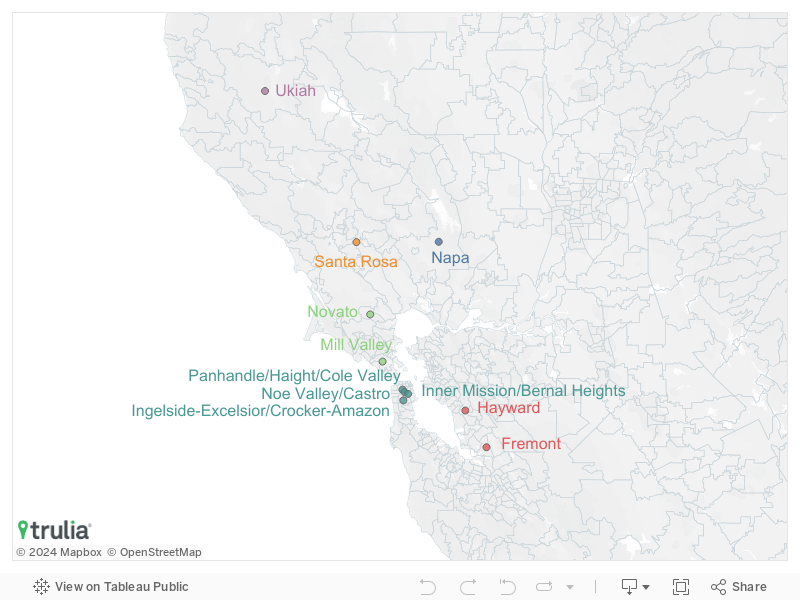
- In February, 71% of searches by Santa Rosa residents were for properties outside of the city, up from 67% of searches a year ago. But the top ZIP codes searched are still either in Santa Rosa or close-by markets such as Ukiah, Clearlake, and Sacramento.
- Many are looking to move in: Inbound searches to Santa Rosa rose8% in February from the same period a year ago. We found users in San Francisco, Oakland, and San Jose were at the top of out-of-town places searching in Sonoma County.
A Market Reshaped By Fire
A swarm of uncontrolled fires burned simultaneously in October. Whole neighborhoods were decimated. Forty-two lives were tragically lost. As expected, Sonoma and Napa counties, and the main city in Sonoma, Santa Rosa, are very different housing markets than they were a year, or even six months ago.
For those who lost homes and choose not to rebuild but want to stay, the outlook may be discouraging. The median home price in Santa Rosa by listing rose 5.5% to $630,000 in March from $597,250 a year ago. And there was hardly a reprieve. The median home price hardly budged after the fire (dropping just $10,000 in November from October) and quickly rose again. Meanwhile, available inventory dropped to 267 at the start of March, down from 434 on Oct. 1, 2017, just before the fire.
| Sonoma County Single-Family Listings | ||||
| Month | Median
Listing Price |
Median Listing Price Per Square Foot | Median Lot Size (Square Foot) | Number of Listings |
| Feb 2017 | $699,000 | $73.29 | 8,712 | 881 |
| Mar 2017 | $689,250 | $73.19 | 9,148 | 900 |
| Apr 2017 | $722,555 | $67.15 | 10,454 | 1008 |
| May 2017 | $720,000 | $70.19 | 10,454 | 1190 |
| Jun 2017 | $725,000 | $67.47 | 10,890 | 1307 |
| Jul 2017 | $729,950 | $66.11 | 11,700 | 1360 |
| Aug 2017 | $699,000 | $66.90 | 10,890 | 1350 |
| Sep 2017 | $725,000 | $66.26 | 11,326 | 1299 |
| Oct 2017 | $749,000 | $61.38 | 12,632 | 1287 |
| Nov 2017 | $750,000 | $59.57 | 13,068 | 1033 |
| Dec 2017 | $750,000 | $60.84 | 12,197 | 829 |
| Jan 2018 | $775,000 | $61.73 | 11,761 | 627 |
| Feb 2018 | $780,750 | $66.18 | 11,108 | 676 |
| Mar 2018 | $749,000 | $69.63 | 10,019 | 775 |
Conversely, the number of vacant lots – most left bare by fire – has soared. In March 231 lots in Santa Rosa were listed for sale, compared to just 69 a year earlier. Many of the lots for sale last year were acreage as opposed to empty single-family home lots. County (Sonoma) wide, 443 lots were listed this month compared to 296 a year ago. Only Napa County is relatively unchanged: 140 lots listed in March, compared to 131 a year ago.
Residents Look Close to Home, But There’s Competition From Outside
Fire clearly hurt supply in Sonoma and Napa counties making it hard for people to relocate within the area and drove up prices. Our analysis also suggests that demand hasn’t budged much either, making it hard for those displaced to stay.
One reason: there’s competition from the South. Bay Area residents are increasingly searching for homes in Sonoma and Napa. Residents from the Bay Area make up eight of the top 10 ZIP codes searching in Sonoma County from the outside.
Overall, searches in Santa Rosa rose 14% in February from the same month last year. The number was driven by a 16% increase in searches initiated from within Santa Rosa and a 13% increase from outside. Likewise for Sonoma County, the increase was 13% overall driven by a 20% increase in local searches and 9% increase in searches initiated outside the county for the same period.
The Impact
Ultimately, the Northern California region affected by fire is coping with the loss of homes as evidenced by the lack of listings for houses and a jump in empty-lot listings. That said, demand remains strong. House hunters appear unwavering in their interest in Sonoma and Napa counties and Santa Rosa, the city which saw the most devastation. As the region rebuilds and new supply comes on the market, house hunters should snap up new supply if current conditions – including high Bay Area home prices – hold.
Methodology
This report uses Trulia data for listings and searches. Listings data is taken as of the first of each month. Monthly searches are calculated by summing total visits across the month. Throughout this report, we refer to Santa Rosa as the city, and not the metropolitan area.

