Buying a home is 23% cheaper than renting nationwide for millennials and now is the best time to buy since 2012 when interest rates were a tad lower.
Trulia’s Rent vs. Buy Report has traditionally assumed a 30-year fixed rate mortgage with a 20% down payment for households moving every seven years. With these assumptions, buying is 36% cheaper than renting on a national basis, based on September home prices. That’s the best differential since 2012 when it was 38% cheaper to buy than rent. Buying is also cheaper than renting in each of the nation’s 100 largest metros.
However, using the Census’ 2014 American Community Survey and a new Trulia consumer poll, we’ve found that the math is different for young households (ages 25-34), who tend to move every five years (*) and can only afford up to a 10% down payment (**). This edition of Rent vs. Buy crunches the numbers for these prospective home buyers.
To compare the costs of owning and renting for young home buyers, we also assumed a 3.85% mortgage rate on a 30-year fixed-rate loan, itemized federal tax deductions and a 25% tax bracket. With those assumptions, buying is not only 23% cheaper than renting nationally, it is also only cheaper than renting in 98 of the nation’s top 100 markets.
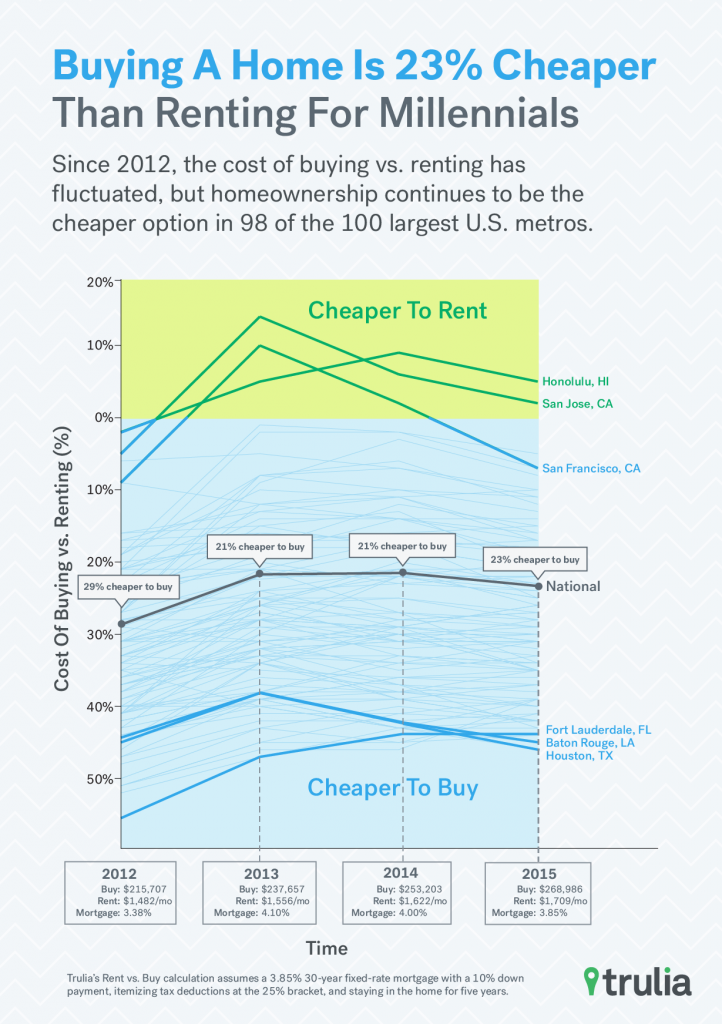
But personal choices aside, here are the current economic conditions that influence today’s market. Nationally, home price growth has outpaced rent growth since 2012. That favors the rent side of the buy vs. rent equation. However, interest rates have returned to near historic lows, now at about 3.85%, after climbing to 4% or higher in 2013 and 2014. In October 2012, rates were about 3.4% for a 30-year-fixed rate mortgage. In that year, young households found that it was 28% cheaper to buy than rent.
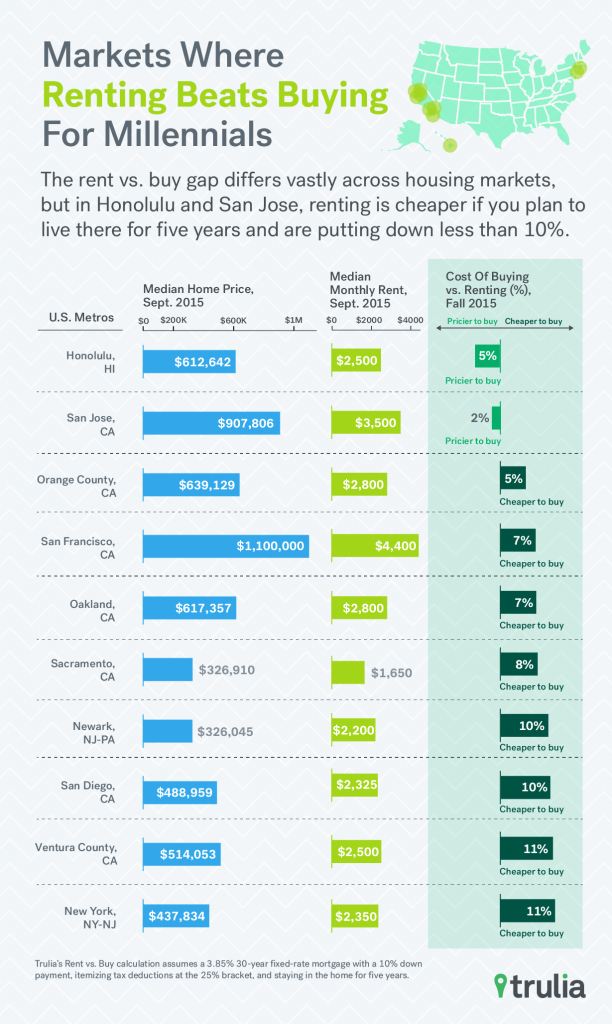
Cheaper to Rent in Honolulu and Silicon Valley
The rent vs. buy gap differs vastly across metros, largely because home prices and rents, property taxes, and home-price appreciation differs by metro. Taking these factors into account, young home buyers in the nation’s 100 markets would find that buying a home ranges from being 5% more expensive than renting in Honolulu to being 46% cheaper to buy a home in Houston.
The only other metro in the top 100 where buying is more expensive than renting a home for young buyers is San Jose, where they’d pay 2% more to buy a home than to rent. Rounding out the top 10 is New York, where buying is now 11% cheaper for younger consumers than renting.
Our rent vs. buy metric is especially tight for young prospective buyers in California. Of the 10 markets nationwide where buying vs. renting is a tougher call, seven are in the Golden State: San Jose, Orange County, San Francisco, Oakland, Sacramento, San Diego, and Ventura County.
| Where Renting Beats Buying (and Where It’s a Tough Call) | ||||
| # | U.S. Metro | Median Home Price, Sept 2015 | Median Rent, Sept 2015 | Cost of Buying vs. Renting (%), Sept 2015 |
| 1 | Honolulu, HI | $612,642 | $2,500 | 5% |
| 2 | San Jose, CA | $907,806 | $3,500 | 2% |
| 3 | Orange County, CA | $639,129 | $2,800 | -5% |
| 4 | San Francisco, CA | $1,100,000 | $4,400 | -7% |
| 5 | Oakland, CA | $617,357 | $2,800 | -7% |
| 6 | Sacramento, CA | $326,910 | $1,650 | -8% |
| 7 | Newark, NJ-PA | $326,045 | $2,200 | -10% |
| 8 | San Diego, CA | $488,959 | $2,325 | -10% |
| 9 | Ventura County, CA | $514,053 | $2,500 | -11% |
| 10 | New York, NY-NJ | $437,834 | $2,350 | -11% |
| Note: Positive numbers mean that buying costs more than renting. Click here to download the full Rent vs. Buy cost considerations for the 100 largest U.S. metros. | ||||
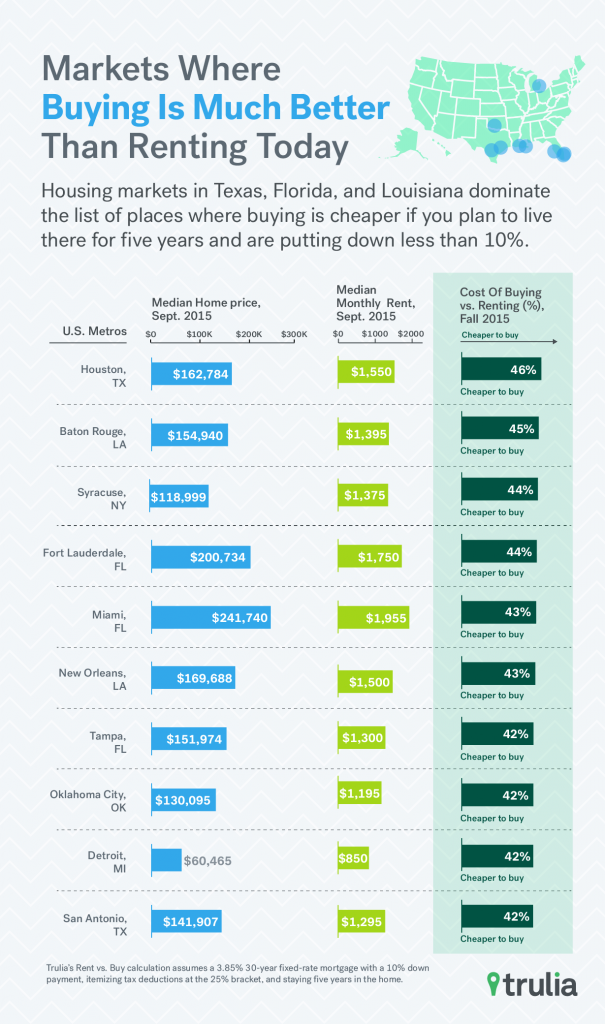
Southern, Midwestern Housing Markets Great for Young Buyers
Buying is clearly a better deal in many Southern markets. Metros in Texas, Florida and Louisiana dominate the top ten list of places where young households will find buying an easier call. In No. 1 Houston, for instance, it is 46% cheaper for younger buyers to buy than rent.
| Where Buying a Home Beats Renting | ||||
| # | U.S. Metro | Median Home Price, Sept 2015 | Median Rent, Sept 2015 | Cost of Buying vs. Renting (%), Sept 2015 |
| 1 | Houston, TX | $162,784 | $1,550 | -46% |
| 2 | Baton Rouge, LA | $154,940 | $1,395 | -45% |
| 3 | Syracuse, NY | $118,999 | $1,375 | -44% |
| 4 | Fort Lauderdale, FL | $200,734 | $1,750 | -44% |
| 5 | Miami, FL | $241,740 | $1,955 | -43% |
| 6 | New Orleans, LA | $169,688 | $1,500 | -43% |
| 7 | Tampa, FL | $151,974 | $1,300 | -42% |
| 8 | Oklahoma City, OK | $130,095 | $1,195 | -42% |
| 9 | Detroit, MI | $60,465 | $850 | -42% |
| 10 | San Antonio, TX | $141,907 | $1,295 | -42% |
| Note: Negative numbers mean that buying costs less than renting. Click here to download the full Rent vs. Buy cost considerations for the 100 largest U.S. metros. | ||||
Rising Prices, Rents in Some Markets Spur Big Swings in Rent vs. Buy Math
Many metros have seen drastic swings in our rent vs. buy metric since 2012 when the housing market first started to turn around. That’s largely because of rebounding home prices and swings in how much prices rise relative to rents, and vice-versa.
In Las Vegas, for example, it is now 20% cheaper to buy than rent. In 2012, it was a whopping 43% cheaper to buy than rent in that metro. Much of this change is due to the fact that price increases outpaced rents in Las Vegas. The median cost of a Las Vegas home has soared to $194,789, up from $124,575 in 2012. Median monthly rents, meanwhile, have risen just $100 in the same period to $1,250. This difference led to an almost 23 percentage point drop in the advantage of buying vs. renting.
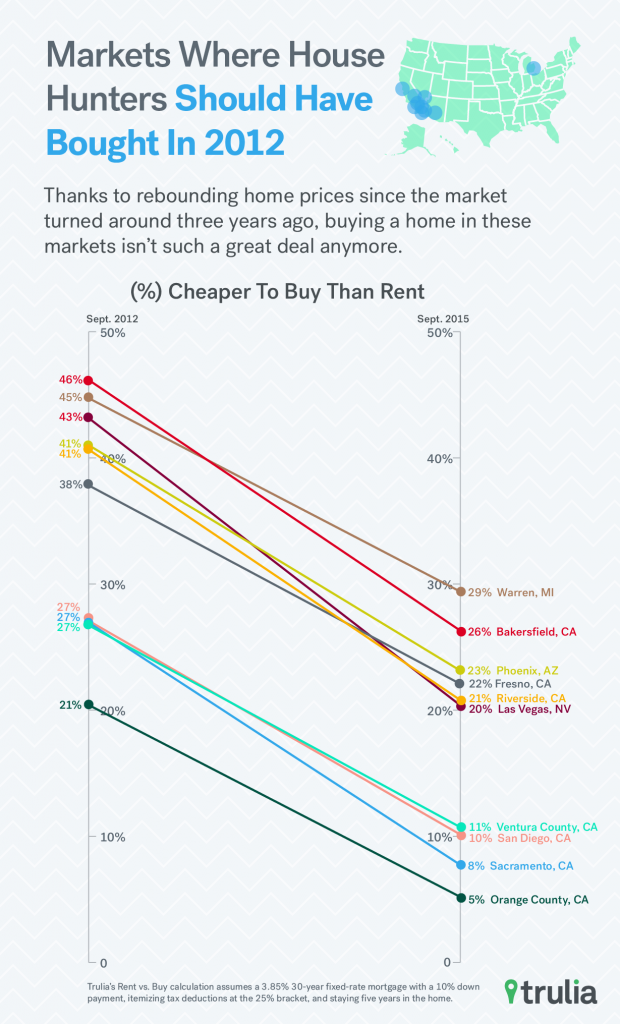
| Where House Hunters Should Have Bought in 2012 | ||||
| # | U.S. Metro | Cost of Buying vs. Renting (%), Sept 2012 | Cost of Buying vs. Renting (%), Sept 2015 | Point Difference in Cost of Buying vs. Renting, 2012-2015 |
| 1 | Las Vegas, NV | -43% | -20% | +23% |
| 2 | Riverside, CA | -41% | -21% | +20% |
| 3 | Bakersfield, CA | -46% | -26% | +20% |
| 4 | Sacramento, CA | -27% | -8% | +20% |
| 5 | Phoenix, AZ | -41% | -23% | +18% |
| 6 | San Diego, CA | -27% | -10% | +17% |
| 7 | Fresno, CA | -38% | -22% | +16% |
| 8 | Ventura County, CA | -27% | -11% | +16% |
| 9 | Warren–Troy–Farmington Hills, MI | -45% | -29% | +15% |
| 10 | Orange County, CA | -21% | -5% | +15% |
| Note: Negative numbers mean that buying costs less than renting. Click here to download the full Rent vs. Buy cost considerations for the 100 largest U.S. metros. | ||||
In some markets, rent growth has outpaced home price growth. That has made home buying an even better financial choice vs. renting in those markets now than in 2012. However, the changes haven’t been as drastic as in Las Vegas.
For example, in San Antonio—which tops the list of 10 metros where buying a home is an even better deal vs. renting now than it was three years ago—younger home buyers would find buying now almost 42% cheaper than renting, up from 33% cheaper in 2012. That makes for an eight-percentage point difference in our buy vs. rent metric.
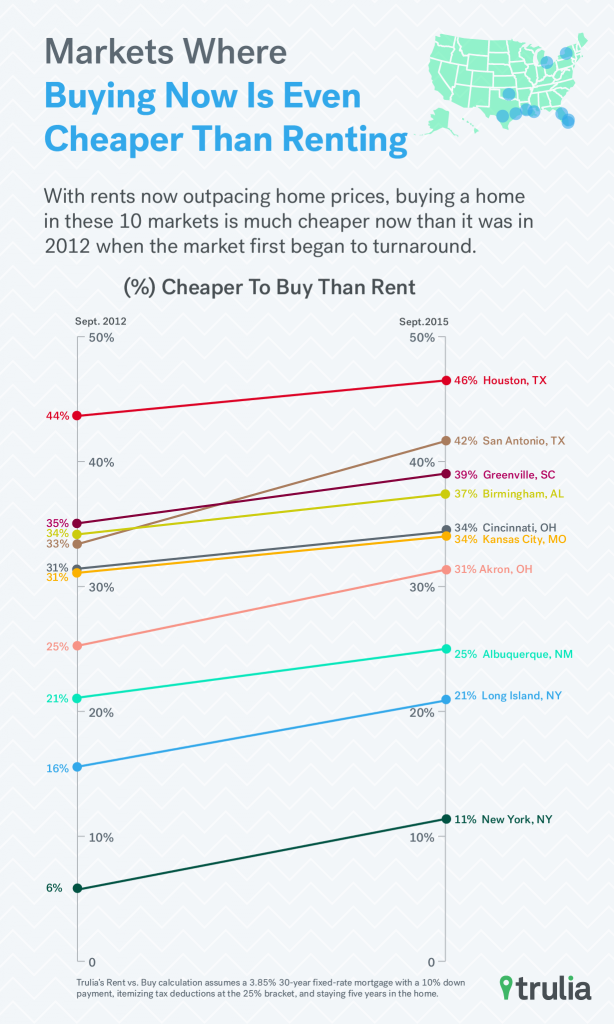
| Where Buying is Much Better Than Renting Today | ||||
| # | U.S. Metro | Cost of Buying vs. Renting (%), Sept 2012 | Cost of Buying vs. Renting (%), Sept 2015 | Point Difference in Cost of Buying vs. Renting, 2012-2015 |
| 1 | San Antonio, TX | -33% | -42% | -8% |
| 2 | Akron, OH | -25% | -31% | -6% |
| 3 | Long Island, NY | -16% | -21% | -6% |
| 4 | New York, NY-NJ | -6% | -11% | -5% |
| 5 | Greenville, SC | -35% | -39% | -4% |
| 6 | Albuquerque, NM | -21% | -25% | -4% |
| 7 | Birmingham, AL | -34% | -37% | -3% |
| 8 | Cincinnati, OH-KY-IN | -31% | -34% | -3% |
| 9 | Kansas City, MO-KS | -31% | -34% | -3% |
| 10 | Houston, TX | -44% | -46% | -3% |
| Note: Negative numbers mean that buying costs less than renting. Click here to download the full Rent vs. Buy cost considerations for the 100 largest U.S. metros. | ||||
Higher Mortgage Rates Could Spur Renting in California
Many economists predict that the Federal Reserve Bank will raise interest rates, now near historic lows, by the year’s end. Nationally, rates would have to nearly double to about 6.5% to equalize the buy vs. rent equation for young buyers. Still, an increase of 25-50 basis points could push mortgage rates to 4.15% – 4.4%. That would make the costs of renting about the same as buying in some large California markets.
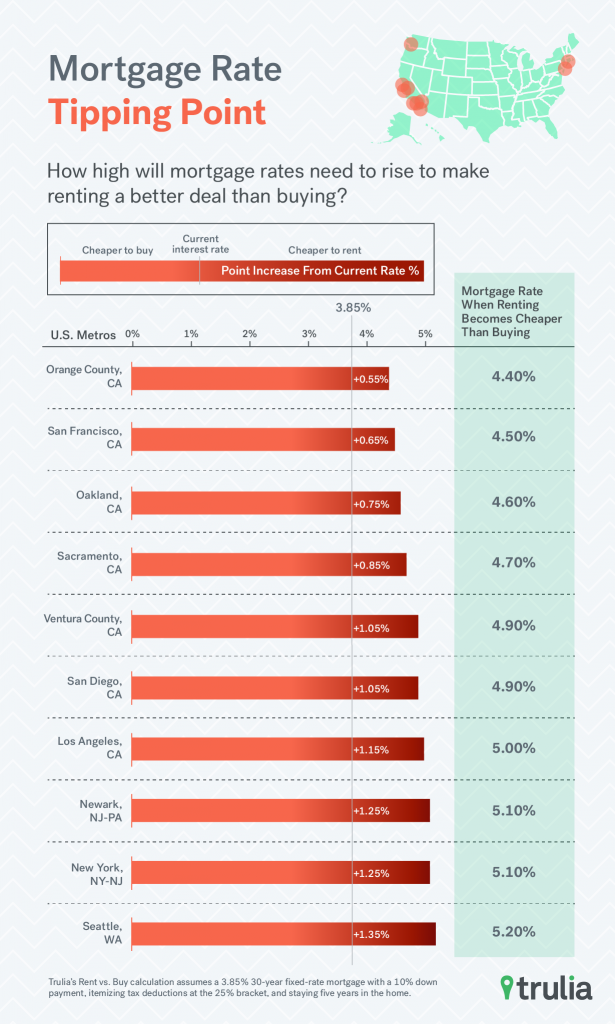
| Mortgage Rate Tipping Point | |||
| # | U.S. Metro | Mortgage Rate Tipping Point When Renting Becomes Cheaper Than Buying | Point Increase Needed to Reach Tipping Point |
| 1 | Orange County, CA | 4.40% | +0.55% |
| 2 | San Francisco, CA | 4.50% | +0.65% |
| 3 | Oakland, CA | 4.60% | +0.75% |
| 4 | Sacramento, CA | 4.70% | +0.85% |
| 5 | Ventura County, CA | 4.90% | +1.05% |
| 6 | San Diego, CA | 4.90% | +1.05% |
| 7 | Los Angeles, CA | 5.00% | +1.15% |
| 8 | Newark, NJ-PA | 5.10% | +1.25% |
| 9 | New York, NY-NJ | 5.10% | +1.25% |
| 10 | Seattle, WA | 5.20% | +1.35% |
| Note: Assumes current mortgage rates of 3.85%. Click here to download the mortgage rate tipping point for the 100 largest U.S. metros. | |||
Orange County, San Francisco, and Oakland are the most vulnerable markets. An increase of interest rates of half a basis point (0.5 percentage points) would make the costs of buying in those markets about the same as renting. In other vulnerable markets, the rate increase would need to be closer to 1.00-1.35 percentage points. However, home buyers in these metros don’t need to panic. The Fed hasn’t increased rates by more than 25 basis points at a time since the Fall of 1988.
FULL RENT VS. BUY METHODOLOGY
Trulia calculates the costs of buying and renting by:
- We use our quality-adjusted measure of home prices and rents, which allows an apples-to-apples comparison between rental and owner-occupied housing units. We looked at median home value and rent in September 2015 in each of the largest 100 metros.
- We calculate the initial total monthly costs of owning and renting, including mortgage payments, maintenance, insurance, and taxes.
- We calculate the future total monthly costs of owning and renting, taking into account expected price and rent appreciation, as well as projected inflation.
- We factor in one-time costs and proceeds, including closing costs, down payment, sale proceeds, and security deposits.
- We calculate net present value, which reveals the opportunity cost of using money to buy a house instead of investing it. Net present value is the worth in today’s dollars of a future stream of payments and proceeds, taking into account expected interest rates.
Trulia’s Rent vs. Buy Calculator lets you compare renting and buying costs using other assumptions about prices, rents, and other factors. It uses the same math that powers our interactive map and this report. You can read our extended methodology here.
(*) 2014 American Community Survey Data shows that Americans aged 25-34 move approximately every five years.
(**) When asked how much their household would be able to put down as a down payment, if they were in the market for a home, 62% of Americans between the ages of 25 and 34 said they could only afford a downpayment of 10% or less on a home purchase.
This survey was conducted online within the United States between October 13th and 15th, 2015 among 2,009 adults (aged 18 and over) of whom 383 are 25-34 by Harris Poll on behalf of Trulia via its Quick Query omnibus product. Figures for age, sex, race/ethnicity, education, region and household income were weighted where necessary to bring them into line with their actual proportions in the population. Propensity score weighting was used to adjust for respondents’ propensity to be online.
All sample surveys and polls, whether or not they use probability sampling, are subject to multiple sources of error which are most often not possible to quantify or estimate, including sampling error, coverage error, error associated with nonresponse, error associated with question wording and response options, and post-survey weighting and adjustments. Therefore, the words “margin of error” are avoided as they are misleading. All that can be calculated are different possible sampling errors with different probabilities for pure, unweighted, random samples with 100% response rates. These are only theoretical because no published polls come close to this ideal.
Respondents for this survey were selected from among those who have agreed to participate in our surveys. The data have been weighted to reflect the composition of the adult population. Because the sample is based on those who agreed to participate in our panel, no estimates of theoretical sampling error can be calculated.

