This morning, the Census Bureau released 2014 data that show whether Americans own, rent, or live under someone else’s roof. (See note.) As we’ve pointed out before, the published homeownership rate is often a misleading guide to what’s really happening in the housing market. For instance, suppose young people move out of their parents’ homes into rental apartments. That would lower the published homeownership rate because the number of renters has increased – even though the number of young homeowners is unchanged.
Using these fresh 2014 data, we update several key measures of housing and living arrangements, including:
- the percentage of young people living with their parents;
- the headship rate, which is the percentage of adults who head a household, either as an owner or a renter;
- our “true” homeownership rate, which equals the percentage of adults who are homeowners.
These three measures are closely related. If young people move out of their parents’ homes and become either renters or homeowners, the share of young adults living with parents goes down, while the headship rate for young adults goes up. Furthermore, the true homeownership rate equals the published homeownership rate times the headship rate – and therefore takes into account whether people are dropping out of or entering the housing market. Thus, it gives a clearer picture of whether the housing market is recovering. With that overview, here’s what the new 2014 data show.
True Young-Adult Homeownership Rate Falls in 2014, Reversing 2013 Increase
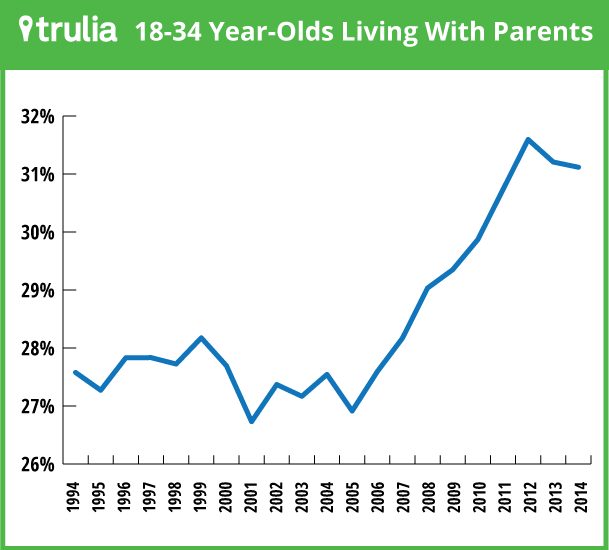
Let’s start with those millennials in the basement. They’re still there, but, ever so slowly, more are moving out. In 2014, 31.1% of 18-34 year-olds lived with their parents, down slightly from 31.2% in 2013 and from the peak of 31.6% in 2012.

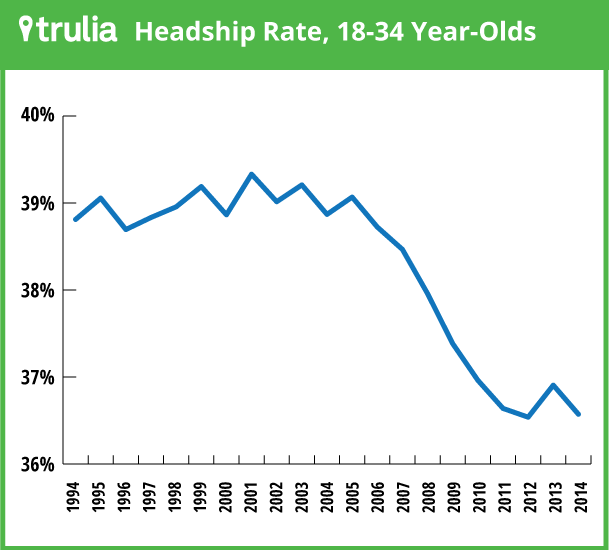
Here’s the wrinkle though. Even though the percentage of young adults living with their parents ticked down a bit, their headship rate did NOT rise. They’re moving out of their parents’ homes, but not forming their own households. The headship rate for 18-34 year-olds fell to 36.6% in 2014, down from 36.9% in 2013, and just slightly above its low of 36.5% in 2012.

If the young adults who moved from their parents’ homes didn’t become renters or homeowners, where did they go? Although the sample size is small, the data show an increase in the percentage of young adults living in households headed by siblings or other relatives.
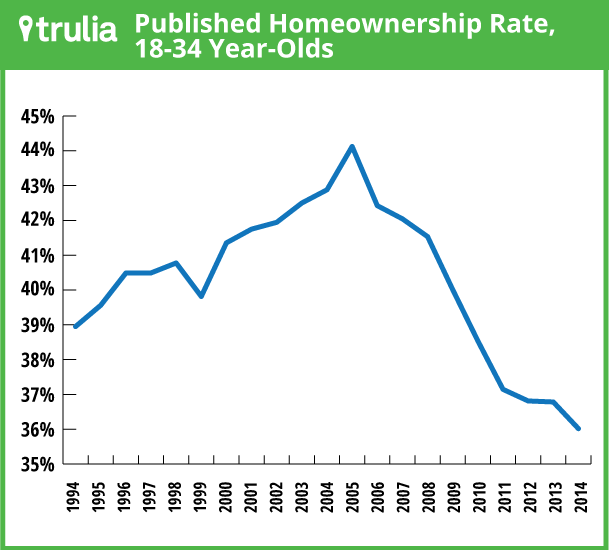
What does this mean for young adult homeownership? The published homeownership rate for 18-34 year-olds fell in 2014 (as has been reported already by the Census using slightly different data):

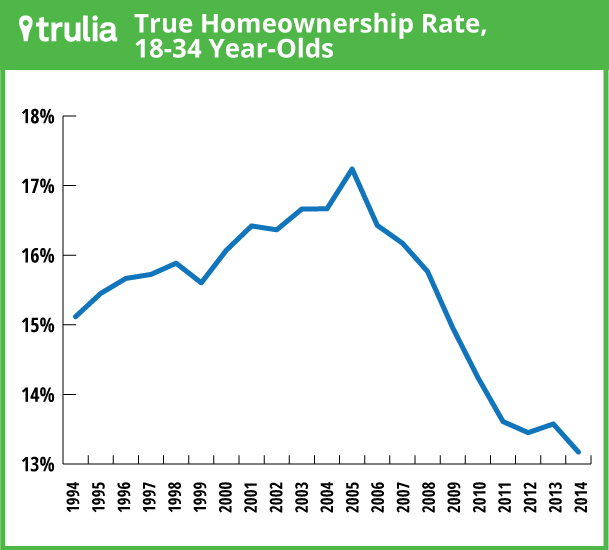
But with the headship rate also falling for young adults, that means the true homeownership rate – the percentage of young adults who own homes – has fallen even more, to a new low of 13.2%.

Remember that this low homeownership rate for young adults is still in line with what we’d expect due to long-term demographic shifts, including later ages of marriage and having children. Adjusting for demographics, the homeownership rate for young adults is still roughly where it was 20 years ago. At the same time, the percentage of young adults who head a renter household rose slightly in 2014 to 23.4%, up from 23.3% in 2013 and significantly higher than the low of 21.8% at the height of the housing bubble in 2005.
Decline in Headship Means Sluggish Household Formation
The recession and recovery had a bigger effect on the headship rate of young adults than on that of older adults. Many young people struggled in the recession and moved in with their parents. However, in 2014, the headship rate fell not just for young adults, but for some older age groups as well. The percentage of 55-64 year-olds living in households headed by their children or other relatives went up, for instance. (There also is a long-term increase in seniors living with their adult children. But that is due to demographic shifts, not the recession.)
Overall, these changes in living arrangements meant a drop in the headship rate among all adults from 51.7% in 2013 to 51.3% in 2014. The share of overall adults who headed a renter household rose slightly, while the share of adults who are homeowners – the “true” homeownership rate” – fell.
This decline in headship means sluggish household formation. Household formation is the change in the total number of households, which depends on two things: (1) the change in the adult population; (2) the change in headship rate, that is, the percentage of adults who head their own households. The latest Census population estimates show an increase of 2.3 million adults between March 2013 and March 2014. If the headship rate stayed constant at its 2013 level, that population growth would have resulted in formation of 1.2 million households. But the decline in headship implies household formation of just 425,000 between March 2013 and March 2014. What’s more, that meager household formation was entirely new renter households, not owner-occupied households.
Thus, today’s new Census data show that the housing market is still struggling to recover. Although a shade fewer young adults are living with their parents, the headship rate declined for both young adults and for adults overall. That’s holding back household formation, especially owner-occupied household formation, and is consistent with the weak home-purchase market seen in recent quarters.
Note: this post is based on the Current Population Survey (CPS) 2014 Annual Social and Economic Supplement (ASEC), which was conducted in March 2014. The Census released the raw data today as well as reports based on these data on income, poverty, and health insurance.
The ASEC counts college students living in dorms as living with their parents. However, other Census data confirm that most college and graduate students reported by the ASEC as living with parents actually are living with parents. The share of millennials living under their parents’ roof jumped during the recession to the highest levels in a generation. The Census reports people living with unrelated roommates as a separate category.
Our published homeownership rate, headship rate, and true homeownership rate for young adults all include an adjustment that counts each spouse in a married couple equally as shared heads of household. This corrects the bias in the CPS toward counting husbands as head of household. See endnote #2 of this post for a fuller explanation.
The Census population estimates mentioned at the end of this post are for the adult (18+) civilian non-institutionalized population, available here.

