For the middle class today, homeownership is well within reach in some parts of the country, but in others, it’s more of a pipe dream than the American Dream. Even after taking income differences into account, homeownership affordability varies hugely across the country. Nationally, home prices still look a bit below their long-term average, and mortgage rates are far below their historical norms – which means that buying a home is still cheaper today than during the housing bubble. But this national average hides enormous differences in what the middle class can afford in each local market.
To assess middle-class affordability, we looked at all of the homes for sale across the U.S. through the eyes of the typical household in each metro area. For every for-sale home, we determined affordability based on whether the total monthly payment for that home was less than 31% of the metro’s median household income. (See note below.)
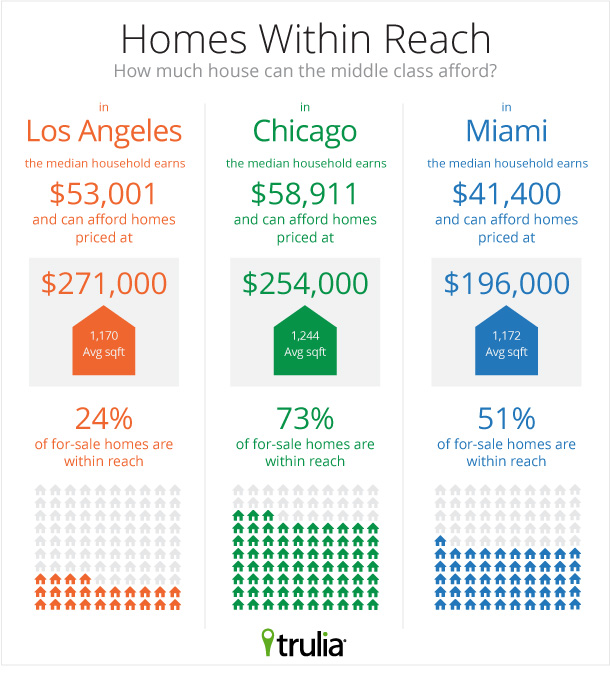
For instance, for a middle-class family in the Chicago metro area, where median household income is $58,911, homes under $254,000 are within reach based on the 31% guideline. Of homes listed for sale in Chicago, 73% are priced below that – which means that nearly three quarters of Chicago homes are “within reach” of the middle class. Remember: we’re defining the “middle class” separately for each metro based on the local median household income.
Looking for Affordability? Go Midwest, Young Man
In the most affordable housing markets, more than 80% of homes for sale today are within reach of the middle class. Even though incomes in the Midwest and in the South are lower than on the coasts, housing costs are lower there even relative to income, making homeownership more affordable. In Akron, OH – the most affordable of the 100 largest metros – 86% of the homes for sale are within reach of the typical household. Including Akron, the six most affordable metros are in Ohio (Dayton, Toledo, Cincinnati) and Indiana (Gary, Indianapolis).
|
Most Affordable Housing Markets for the Middle Class |
||||
| # | U.S. Metro |
% of for-sale homes affordable for middle class, October 2013 |
Median size of affordable for-sale homes, October 2013 (square feet) |
% of for-sale homes affordable for middle class, October 2012 |
| 1 | Akron, OH |
86% |
1,336 |
86% |
| 2 | Dayton, OH |
85% |
1,360 |
89% |
| 3 | Toledo, OH |
85% |
1,332 |
88% |
| 4 | Gary, IN |
84% |
1,512 |
88% |
| 5 | Indianapolis, IN |
83% |
1,656 |
88% |
| 6 | Cincinnati, OH-KY-IN |
83% |
1,444 |
87% |
| 7 | Detroit, MI |
83% |
1,075 |
89% |
| 8 | Columbia, SC |
83% |
1,661 |
86% |
| 9 | Columbus, OH |
82% |
1,400 |
86% |
| 10 | Birmingham, AL |
82% |
1,396 |
86% |
| Find out how affordable each of the 100 largest metros are for the Middle Class: Excel and PDF | ||||
The least affordable housing market in the U.S. is San Francisco. Even though the median household income is 60% higher in San Francisco than in Akron – which means San Franciscans can afford more expensive homes – the median price per square foot in San Francisco is close to seven times higher than in Akron. As a result, just 14% of the homes for sale in San Francisco are within reach of its relatively well-paid middle class.
|
Least Affordable Housing Markets for the Middle Class |
||||
| # | U.S. Metro |
% of for-sale homes affordable for middle class, October 2013 |
Median size of affordable for-sale homes, October 2013 (square feet) |
% of for-sale homes affordable for middle class, October 2012 |
| 1 | San Francisco, CA |
14% |
1,000 |
24% |
| 2 | Orange County, CA |
23% |
1,057 |
44% |
| 3 | Los Angeles, CA |
24% |
1,170 |
39% |
| 4 | New York, NY-NJ |
25% |
978 |
30% |
| 5 | San Diego, CA |
28% |
1,056 |
46% |
| 6 | San Jose, CA |
31% |
1,133 |
46% |
| 7 | Ventura County, CA |
32% |
1,222 |
56% |
| 8 | Fairfield County, CT |
36% |
1,317 |
41% |
| 9 | Honolulu, HI |
40% |
778 |
47% |
| 10 | Boston, MA |
41% |
1,250 |
53% |
| Find out how affordable each of the 100 largest metros are for the Middle Class: Excel and PDF | ||||
The middle class faces two additional challenges in America’s least affordable markets:
- Affordable homes aren’t only hard to find; they’re also small. The median size of affordable homes in San Francisco is 1,000 square feet, and they’re even smaller in New York and Honolulu. That’s a lot less space than the typical affordable home in Cincinnati (1,444 square feet), Columbus (1,400 square feet), and Indianapolis (1,656 square feet).
- Affordability is worsening. One year ago, more than half of homes for sale in Boston and Ventura County, CA, were affordable; this October, just 32% and 41% are, respectively. Affordability is declining because home prices are rising much faster than median incomes and also because mortgage rates have risen over the past year.
The Most Affordable Parts of the Least Affordable Housing Markets
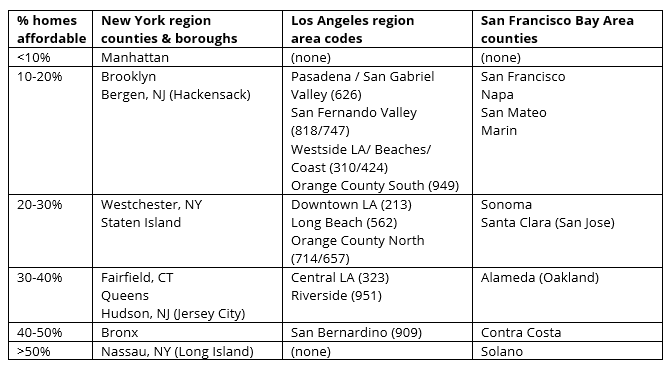
The least affordable metros are clustered in three regions of the country: New York, Los Angeles, and the San Francisco Bay Area. But each of these three regions have parts where their middle classes have a better shot at homeownership. To identify these areas, we divided the New York and San Francisco regions by counties, and the greater Los Angeles region by telephone area codes since the counties of southern California are very large.
Comparing the parts of these three regions, two facts jump out. First of all, Manhattan stands alone in its lack of affordability. New York’s middle class can afford only 2.5% of the for-sale homes in Manhattan – and the homes that are affordable in Manhattan are typically just 500 square feet. In fact, even the least affordable parts of the two California regions we looked at – Pasadena / San Gabriel Valley and San Francisco County – are roughly as affordable as Brooklyn and more affordable than Manhattan.
The second fact is that all three regions have parts where at least 40% of for-sale homes are affordable to the middle class: the Bronx and Nassau County in New York, San Bernardino near Los Angeles, and Contra Costa and Solano counties in the San Francisco Bay Area. However, greater affordability in these expensive regions often comes at a high cost: time. These areas all require long commutes to get to the job centers of their regions.
Affordability ranges widely both within and between metros. In parts of New York and California, affordability is the most pressing housing concern – even though mortgage rates are still well below historical norms and buying is cheaper than renting. Yet elsewhere in the country, affordability is a distant worry compared with vacancies, foreclosures, and sluggish local job growth. All housing is local – and so are the biggest housing challenges.
Note: The total monthly payment includes the mortgage payment assuming a 4.5% 30-year fixed rate mortgage (3.5% for the 2012 comparison) with 20% down, property taxes for that metro, and insurance. We chose 31% of income as the affordability cutoff to be consistent with government guidelines for affordability: both the Federal Housing Administration and the Home Affordable Modification Program use 31% of pre-tax income going toward monthly housing payments for assessing whether a home is within reach for a borrower. Note that the 43% debt-to-income rule for Qualified Mortgages is for total debt, not housing debt.
We looked at all for-sale homes on Trulia on October 2, 2013, and October 2, 2012.


