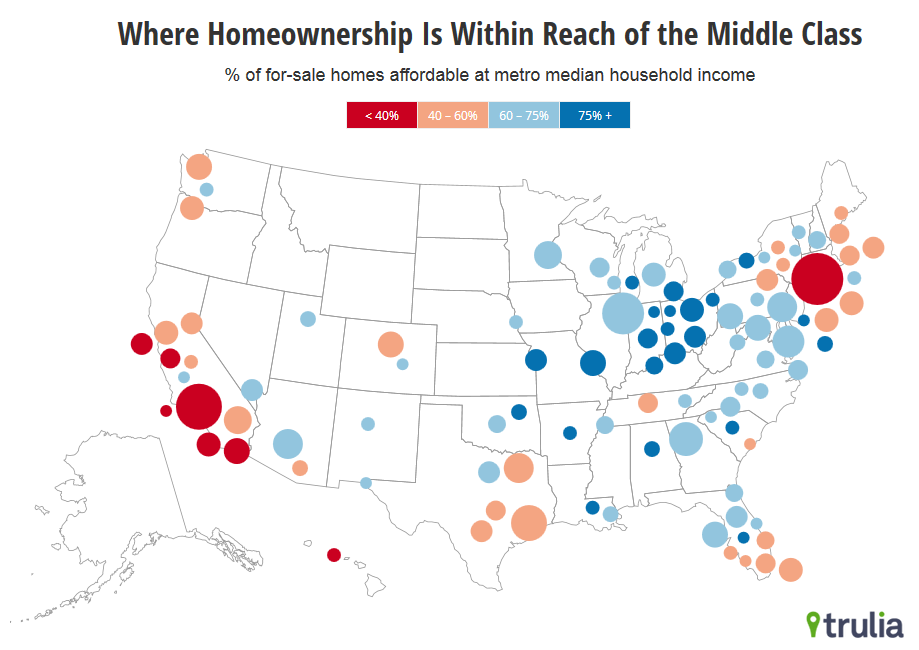
Where can the middle class bear the cost of buying a home? In the past year, affordability has fallen modestly, hurt by rising home prices, but helped by lower mortgage rates. Nationally, 59% of homes for sale are within reach of the middle class, compared with 62% last October. Nonetheless, the big picture is that prices still look undervalued compared with fundamentals and historically low mortgage rates make buying much cheaper than renting. Still, affordability is a growing problem.
We measure affordability as the share of homes for sale on Trulia within reach of a middle-class household. Our standard is whether the total monthly payment, including mortgage, insurance, and property taxes, is less than 31% of the metro area’s median household income. (See note below.) We define middle class separately for each metro based on the local median household income. Thus, what we consider affordable varies from market to market.
For instance, in metro Atlanta, median household income is $55,000. Homes priced under $276,000 are affordable based on the 31% guideline. On November 7, 2014, 71% of the homes for sale in Atlanta were listed for less than $276,000. That means that more than two-thirds of metro Atlanta homes are within reach of the middle class.
Austin and Miami Join California Markets on the Least Affordable List
The five most affordable markets are in Ohio, Indiana, and upstate New York. In those markets, more than 80% of homes for sale are within reach of the middle class. The South is relatively affordable too, with Birmingham, AL and Columbia, SC among the 10 most affordable markets.
|
Most Affordable Housing Markets for the Middle Class |
||||
| # | U.S. Metro | % of for-sale homes affordable for middle class, Nov 2014 | Median size of affordable for-sale homes, Nov 2014 (square feet) | % of for-sale homes affordable for middle class, Oct 2013 |
| 1 | Dayton, OH | 85% | 1400 | 85% |
| 2 | Rochester, NY | 83% | 1400 | 76% |
| 3 | Akron, OH | 83% | 1350 | 86% |
| 4 | Gary, IN | 81% | 1500 | 84% |
| 5 | Toledo, OH | 81% | 1350 | 85% |
| 6 | Birmingham, AL | 80% | 1400 | 82% |
| 7 | Kansas City, MO-KS | 79% | 1400 | 80% |
| 8 | Camden, NJ | 79% | 1450 | 79% |
| 9 | Columbia, SC | 79% | 1700 | 83% |
| 10 | Detroit, MI | 79% | 1050 | 83% |
| Find out how affordable each of the 100 largest metros are for the Middle Class: Excel and PDF | ||||
Six of the seven least affordable markets are in California. A middle-class household can afford just 15% of homes for sale in San Francisco and 22% in Los Angeles. In New York, only 25% of homes for sale are within reach. Joining the least affordable list for the first time are Austin and Miami. In Austin, just 40% of homes for sale are within reach of the middle class, down from 50% last fall. Miami has seen a similar drop in affordability. In total, in 20 of the 100 largest metros, middle-class households can afford fewer than 50% of homes.
|
Least Affordable Housing Markets for the Middle Class |
||||
| # | U.S. Metro | % of for-sale homes affordable for middle class, Nov 2014 | Median size of affordable for-sale homes, Nov 2014 (square feet) | % of for-sale homes affordable for middle class, Oct 2013 |
| 1 | San Francisco, CA | 15% | 1050 | 14% |
| 2 | Los Angeles, CA | 22% | 1250 | 24% |
| 3 | San Diego, CA | 25% | 1100 | 28% |
| 4 | New York, NY-NJ | 25% | 1050 | 25% |
| 5 | Orange County, CA | 26% | 1100 | 23% |
| 6 | San Jose, CA | 30% | 1200 | 31% |
| 7 | Ventura County, CA | 33% | 1250 | 32% |
| 8 | Honolulu, HI | 38% | 700 | 40% |
| 9 | Austin, TX | 40% | 1800 | 50% |
| 10 | Miami, FL | 41% | 1150 | 51% |
| Find out how affordable each of the 100 largest metros are for the Middle Class: Excel and PDF | ||||

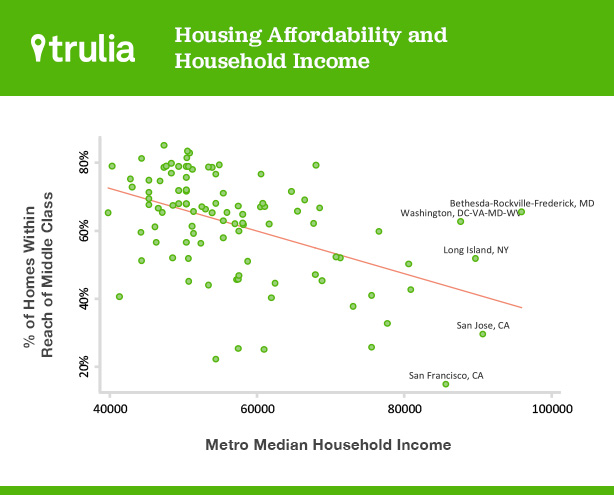
Surprisingly, high-income metros are generally less, not more, affordable. Housing prices tend to be so high in metros with high incomes that affordability ends up being worse than in low-income metros. Why? High-income households bid up home prices, and high prices push out lower-income households. In addition, higher-income metros tend to have less new construction than lower-income metros do. As a result, high-income metros such as San Francisco and San Jose are among the least affordable, even after taking income into account.
Bucking the trend are Washington, DC and the Bethesda metro next door, where incomes are high and more than 60% of homes are within reach of the middle class.

The Least Affordable Parts of the Least Affordable Metros
Of course, affordability varies within metros. To dig deeper in the least affordable metros, we zoom down one level to look at sub-markets – individual counties or, for enormous counties like Los Angeles, the territories covered by telephone area codes. For example, although metro San Francisco is less affordable than metro New York, the borough of Manhattan is less affordable than the city of San Francisco (see note). In fact, Brooklyn and the San Gabriel Valley (east of downtown Los Angeles) are as unaffordable as the city of San Francisco.
So the next time someone says “Oakland is the new Brooklyn,” remind them that housing costs in Brooklyn actually rival those of San Francisco, not Oakland. In Alameda County, which includes Oakland, 32% of homes are within reach of the middle class – similar to Queens (33%), not Brooklyn (12%).
| Least Affordable Housing Sub-Markets for the Middle Class | |||
| # | U.S. Sub-Market | U.S. Metro | % of for-sale homes affordable for middle class, Nov 2014 |
| 1 | Manhattan | NYC | 2% |
| 2 | Pasadena / San Gabriel Valley (626) | LA | 11% |
| 3 | Brooklyn | NYC | 12% |
| 4 | San Francisco (city= county) | SF | 12% |
| 5 | Westside LA/ Beaches/ Coast (310/424) | LA | 14% |
| 6 | Marin | SF | 15% |
| 7 | Downtown LA (213) | LA | 16% |
| 8 | Napa | SF | 16% |
| 9 | San Fernando Valley (818/747) | LA | 16% |
| 10 | San Mateo | SF | 17% |
| Note: sub-markets are counties in most metros, including boroughs in New York, but are area code territories in metros where counties are unusually large. | |||
Just Under Half of Homes are Within Reach of Millennials
For younger adults, affordability is yet a bigger challenge. Households headed by millennials – people younger than 35 – are at the age when people begin to think about buying a home. But their incomes are lower than those of older households. To explore affordability for this group, we use metro median income for millennial-headed households.
Nationwide, just 49% of for-sale homes are within reach of the median-income millennial household, compared with 59% for the median household regardless of age. In 45 of the 100 largest metros, the majority of homes for sale are beyond the reach of the typical millennial household. Those metros include not only expensive coastal markets such as Los Angeles and Honolulu, but also such places as Newark, Tucson, and Tacoma, WA. Austin and Oakland are among the 10 least affordable housing markets for millennials.
One surprise in this analysis: In two of the 100 largest metros – San Francisco and New York — the median income for millennial households is actually higher than median income for all households. Those markets have industries that often pay younger people well. But they also are such expensive markets that even well-paid young people must double up to be able to live there. Many find themselves priced out entirely. Even with those high-income millennials, San Francisco and New York are respectively the least and tenth-least affordable markets for millennials.
| Least Affordable Housing Markets for Typical Millennial Household | ||||
| # | U.S. Metro | % of for-sale homes affordable for median millennial household, Nov 2014 | Median income, millennial households | Median income, all households |
| 1 | San Francisco, CA | 16% | 90000 | 86000 |
| 2 | Orange County, CA | 17% | 60000 | 76000 |
| 3 | Los Angeles, CA | 17% | 48000 | 54000 |
| 4 | San Diego, CA | 18% | 52000 | 61000 |
| 5 | Ventura County, CA | 20% | 63000 | 78000 |
| 6 | Austin, TX | 22% | 47000 | 62000 |
| 7 | Honolulu, HI | 25% | 56000 | 73000 |
| 8 | San Jose, CA | 27% | 87000 | 91000 |
| 9 | Oakland, CA | 27% | 61000 | 76000 |
| 10 | New York, NY-NJ | 28% | 60000 | 57000 |
| Find out how affordable each of the 100 largest metros are for the Middle Class: Excel and PDF | ||||
For both millennials and the middle class generally, affordability is worsening. Annual home-price gains have slowed to 6.4% and will probably continue to ease. But that’s still a faster pace than gains in median income, which is rising at roughly the rate of inflation (1.5% in 2013). Plus, mortgage rates are likely to rise from their current low levels. Unless incomes increase substantially, homeownership will slip further beyond the reach of many households.
Note: We measure affordability as the share of homes for sale on Trulia on November 7, 2014, within reach of a middle-class household. Our standard is whether the total monthly payment, including mortgage, insurance, and property taxes, is less than 31% of the metro area’s median household income. We define middle class separately for each metro based on the local median household income. The total monthly cost includes the mortgage payment assuming a 4.2% 30-year fixed rate mortgage (versus 4.5% in the October 2013 calculation) with 20% down, property taxes based on average metro property tax rate, and insurance. We chose 31% of income as the affordability cutoff to be consistent with government guidelines for affordability. Both the Federal Housing Administration and the Home Affordable Modification Program use 31% of pre-tax income going toward monthly housing payments for assessing whether a home is within reach for a borrower.
Median household income is calculated from the 2013 American Community Survey (ACS) Public Use Microdata Sample (PUMS) using the 2009 metropolitan area definitions. Metro areas and divisions comprise one or more counties. In our sub-market analysis, we used counties or, in metros with very large counties like Los Angeles, the geographic footprints of telephone area codes.
Millennial households are those where the “reference person” (the head of household) is less than 35 years old.
Household incomes are rounded to the nearest $1000. Square footage is rounded to the nearest 50.

