Christmas is the biggest holiday of the year for most Americans. It also stands out as the only federal holiday with religious origins: all other federal holidays commemorate events or people in American history or mark the start of the secular calendar. America is a predominately Christian country: 76% of adults identify as Christian, only 4% identify with a non-Christian faith, and the remaining 20% either identify with no religion or declined to answer (American Religion Identification Survey, 2008). But for America’s largest non-Christian religious minorities–Jews, Muslims, Hindus, and Buddhists–Christmas has a different meaning. To be sure, many Jews, Muslims, Hindus, and Buddhists join Christian friends and family in Christmas celebrations. Others create alternative traditions: Chinese restaurants and movies are packed on Christmas, for instance, and the Society of Young Jewish Professionals organizes annual “MatzoBall” parties on Christmas Eve in several cities.
In honor of Christmas, we took a look at the metros with the most and least non-Christian religious minorities in America. Jews, Muslims, Hindus, and Buddhists together account for 9.6% of New York’s population – more than any other metro — followed by Edison–New Brunswick, NJ, and San Jose, CA. (See note at end on data source and definitions.) At the other extreme, Greenville, SC, Knoxville, TN, and El Paso, TX, have the fewest non-Christian religious minorities as a share of their population – making “Merry Christmas” a more appropriate holiday greeting than in New York. Each religious group has a very different geographic pattern, so let’s look at each separately first before pulling it all together.
Mapping the Major Non-Christian Religions
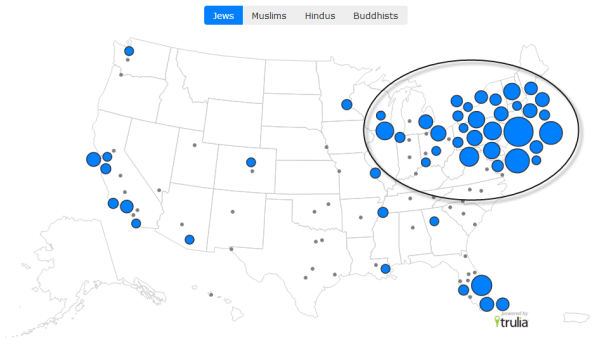
America’s Jews are concentrated in the New York region and elsewhere on the East Coast. Jews account for 5.8% of the New York metro population, higher than any other metro, followed by neighboring Edison–New Brunswick, NJ, and Long Island, NY. Outside of the Northeast, the only metros in the top 10 for Jewish density are Lake County–Kenosha County (north of Chicago) and West Palm Beach, FL. None of the metros in the western half of the country make this top 10 list:
| # | U.S. Metro |
Jewish share of metro population |
| 1 | New York, NY-NJ |
5.8% |
| 2 | Edison–New Brunswick, NJ |
4.0% |
| 3 | Long Island, NY |
3.5% |
| 4 | West Palm Beach, FL |
2.8% |
| 5 | Bethesda–Rockville–Frederick, MD |
2.5% |
| 6 | Lake County-Kenosha County, IL-WI |
2.2% |
| 7 | Newark, NJ-PA |
2.1% |
| 8 | Fairfield County, CT |
2.0% |
| 9 | Baltimore, MD |
1.8% |
| 10 | Middlesex County, MA |
1.8% |
| Among 100 largest metros. Includes only Jews affiliated with a congregation. See note at end of post.
|
||
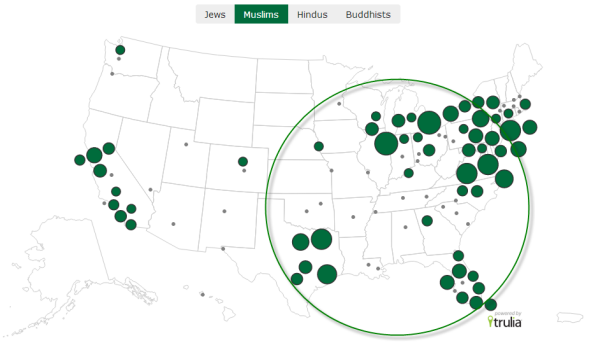
Muslims, unlike Jews, are more likely to live in the Midwest, Texas, and Virginia, with Chicago and Detroit having the highest density. Only New York and Newark are on the top 10 list for both Jews and Muslims. But no West Coast metros make the list for Muslims, either:
| # | U.S. Metro |
Muslim share of metro population |
| 1 | Chicago, IL |
3.7% |
| 2 | Detroit, MI |
3.7% |
| 3 | New York, NY-NJ |
2.9% |
| 4 | Richmond, VA |
2.8% |
| 5 | Washington, DC-VA-MD-WV |
2.8% |
| 6 | Dallas, TX |
2.7% |
| 7 | Houston, TX |
2.7% |
| 8 | Virginia Beach-Norfolk, VA-NC |
2.1% |
| 9 | Fort Worth, TX |
1.9% |
| 10 | Newark, NJ-PA |
1.8% |
| Among 100 largest metros. Includes only Muslims affiliated with a congregation. See note at end of post.
|
||
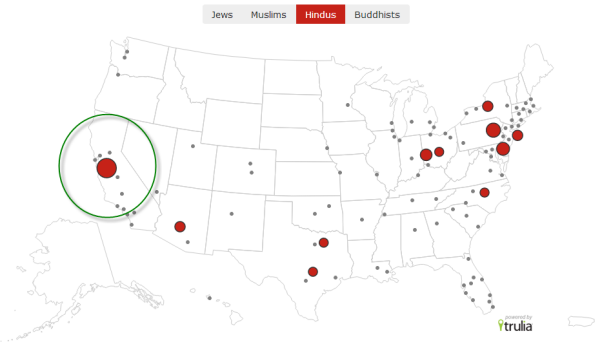
The Hindu population is centered on San Jose. Hindus are also concentrated in several smaller metros, like Allentown and Wilmington:
| # | U.S. Metro |
Hindu share of metro population |
| 1 | San Jose, CA |
2.4% |
| 2 | Allentown, PA-NJ |
1.4% |
| 3 | Wilmington, DE-MD-NJ |
1.1% |
| 4 | Dayton, OH |
1.0% |
| 5 | Syracuse, NY |
0.7% |
| 6 | Edison–New Brunswick, NJ |
0.7% |
| 7 | Phoenix, AZ |
0.7% |
| 8 | Austin, TX |
0.6% |
| 9 | Columbus, OH |
0.6% |
| 10 | Dallas, TX |
0.5% |
| Among 100 largest metros. Includes only Hindus affiliated with a congregation. See note at end of post.
|
||
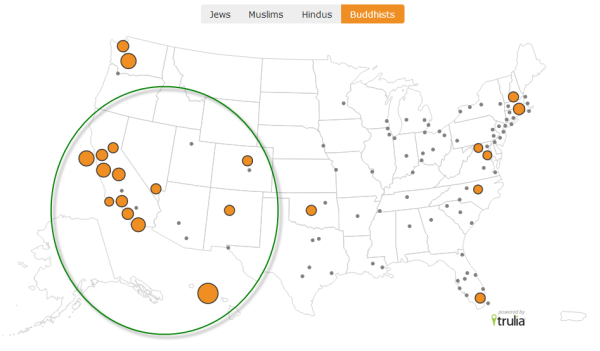
Finally, the Buddhists. Honolulu, with its large Asian-American population, has the largest share of Buddhists. Nine out of 10 metros with the highest share of Buddhists are on or near the Pacific Ocean; the only top 10 metro for Buddhists east of California is Worcester, MA:
| # | U.S. Metro |
Buddhist share of metro population |
| 1 | Honolulu, HI |
2.9% |
| 2 | Tacoma, WA |
1.7% |
| 3 | San Francisco, CA |
1.5% |
| 4 | San Jose, CA |
1.2% |
| 5 | San Diego, CA |
1.2% |
| 6 | Fresno, CA |
1.0% |
| 7 | Seattle, WA |
1.0% |
| 8 | Oakland, CA |
0.9% |
| 9 | Los Angeles, CA |
0.9% |
| 10 | Worcester, MA |
0.9% |
| Among 100 largest metros. Includes only Buddhists affiliated with a congregation. See note at end of post.
|
||
Larger, Expensive Metros Lead in Religious Diversity
Even though no metros have high shares of all of the four religious groups, all four religions are more likely to live in larger, more expensive metros than the U.S. population overall. Jews are the most urban of the four religions: 67% of Jews live in the largest 25 metros (compared to 33% of the overall U.S. population), and 92% of Jews live in the largest 100 metros (compared to 62% of the overall U.S. population). Muslims, Hindus, and Buddhists are also all disproportionately centered in large metros. Furthermore, all four groups live in more expensive markets than the U.S. average:
| Religious Minority |
% in largest 25 metros |
% in largest 100 metros |
Average metro asking price per SQFT |
| Jews |
67% |
92% |
$187 |
| Muslims |
59% |
84% |
$142 |
| Hindus |
47% |
87% |
$150 |
| Buddhists |
48% |
83% |
$179 |
| Total US population |
33% |
62% |
$125 |
Adding up all the individual groups’ shares together, we arrive at the metros with the highest and lowest percentage of non-Christian religious minorities in the U.S. In New York, Edison–New Brunswick, NJ, San Jose, Long Island, and Chicago, more than 5% of the population is Jewish, Muslim, Hindu, or Buddhist. The top 10 list includes some of America’s largest (New York, Chicago) and most expensive (San Jose) metros. Aside from Chicago and Dallas, all ten are on either the East Coast or West Coast.
| # | U.S. Metro |
share of metro population: total for Jews, Muslims, Hindus, and Buddhists |
| 1 | New York, NY-NJ |
9.6% |
| 2 | Edison–New Brunswick, NJ |
6.2% |
| 3 | San Jose, CA |
5.3% |
| 4 | Long Island, NY |
5.1% |
| 5 | Chicago, IL |
5.1% |
| 6 | Newark, NJ-PA |
4.8% |
| 7 | Bethesda–Rockville–Frederick, MD |
4.6% |
| 8 | Washington, DC-VA-MD-WV |
4.5% |
| 9 | West Palm Beach, FL |
4.1% |
| 10 | Dallas, TX |
4.0% |
| Among 100 largest metros. Includes only those affiliated with a congregation. See note at end of post.
|
||
The metros with the lowest share of non-Christian religious minorities are smaller metros in the South, Southwest, and Mountain states. The difference in religious diversity between New York, for instance, and these metros is huge: the share of religious minorities is more than 25 times higher in New York than in Greenville, SC, and Knoxville, TN–even after adjusting for the overall population size.
| # | U.S. Metro |
share of metro population: total for Jews, Muslims, Hindus, and Buddhists |
| 1 | Greenville, SC |
0.3% |
| 2 | Knoxville, TN |
0.4% |
| 3 | El Paso, TX |
0.5% |
| 4 | Colorado Springs, CO |
0.6% |
| 5 | Lakeland–Winter Haven, FL |
0.6% |
| 6 | Little Rock, AR |
0.7% |
| 7 | Baton Rouge, LA |
0.7% |
| 8 | Tulsa, OK |
0.7% |
| 9 | Charleston, SC |
0.7% |
| 10 | Charlotte, NC-SC |
0.7% |
| Among 100 largest metros. Includes only those affiliated with a congregation. See note at end of post.
|
||
What does it all mean? It’s not just housing that’s local: even Christmas is local. Where you are has a lot to do with whether you’ll be cooking a feast or getting dim sum; going to church or to a MatzoBall; and saying “Merry Christmas” or wishing “Happy Holidays” to your neighbors.
This post is based on data from the Association of Religion Data Archives, which includes people who are members of religious congregations (“adherents”). People who identify with a religious group but are not affiliated with a congregation may not be included in these counts. The U.S. Census does not ask about religious affiliation or identity because the government is legally forbidden from asking about religion in any mandatory survey, like the decennial Census.


