
It’s one thing to search a city for listings, it’s another to know that city inside and out. A home is more than just a building, it’s a neighborhood and part of a community. What are the hidden gems that locals know best, that outsiders don’t know to look for?
The short answer: it’s the ‘burbs.
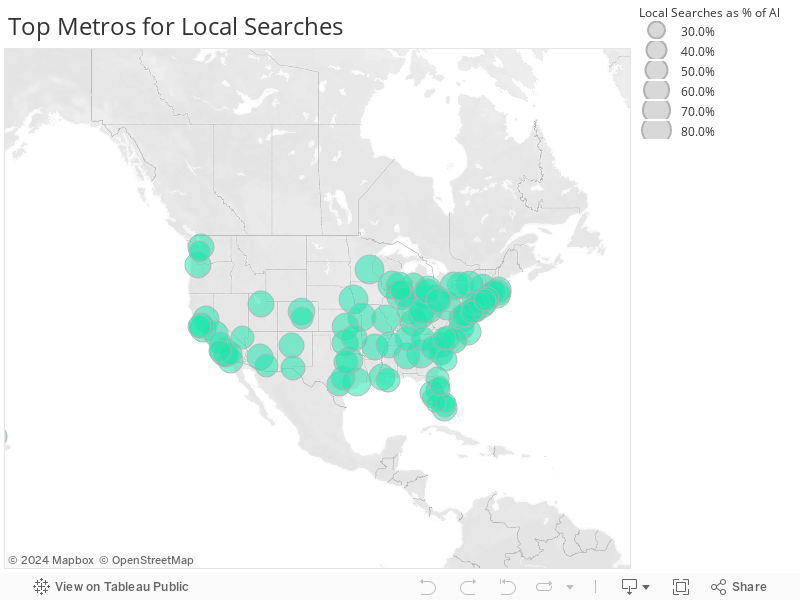
When it comes to home searches, it turns out locals are keeping secrets. We examined our search data for some of America’s hottest housing markets. We took local searches and compared them to out-of-town searches. The result? We found locals were more likely to search suburbs missed by out-of-towners.
Back to the ‘Burbs
WeI’m identified the five most locally searched zip codes in 10 of America’s hottest housing markets. While out-of-town searchers focus more on places that are either well known or discussed most online, locals have hidden-away spots overlooked by non-locals.
When compared to out-of-town search destinations, the suburbs are consistently the most popular areas for locals. While outsiders ooh and aah over big city downtowns, locals are more likely to want to stay in the ‘burbs, or move away from the hustle and bustle of city life.
- Local Rules: Nationally, 60% of all home searches originate from the same metro.
- Don’t Crowd Me: 70% of the top locally searched zip codes are less crowded by people than the average density of the metro they were in – a classic tell the neighborhoods are more suburban.
- Minivans over Buses: None of the top locally searched zip codes in Washington, Atlanta, or Chicago were dense urban neighborhoods.
- Highrise Haven: The sole exception to the suburban trend is Miami. Locals there search more urban neighborhoods within the city such as Hialeah Gardens.
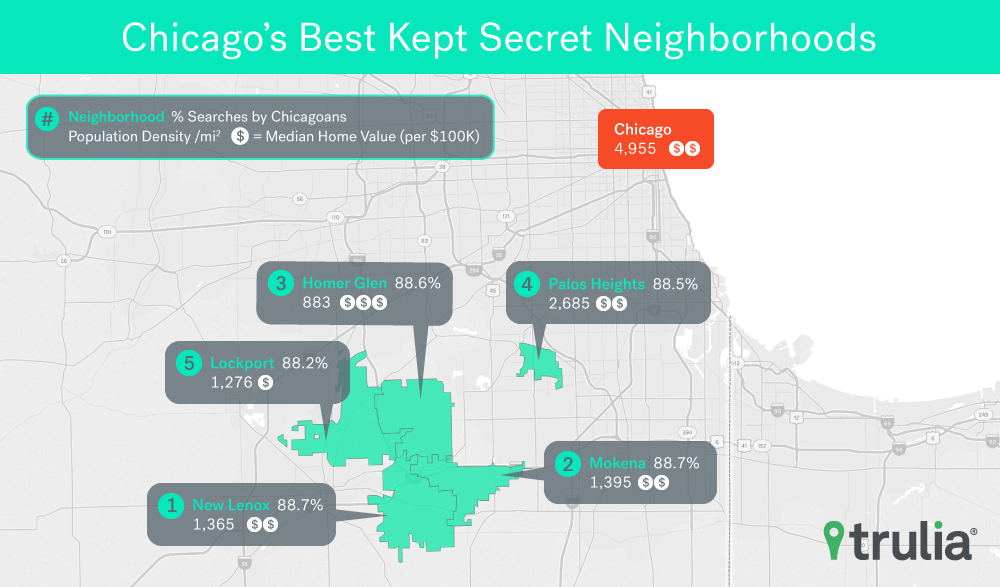
Chicago Is the Top For Local Searches By Locals
Who loves Chicago? Chicagoans. Four out of five home searches in the market originate from within metro, or what locals call Chicagoland. This could be from intense local interest, but it’s also possible this number comes from a lack of outside interest in Chicago. Between 2011 and 2015, Chicago’s population has only grown by 1.2%, the 17th slowest growth of America’s top 100 largest housing markets. Chicago is America’s third largest housing market, so Chicago’s slow growth may be indicative of a negative trend for Chicago as a whole, along with Chicago’s 5.3% unemployment rate, the 13th highest in the U.S.
| Chicago-Naperville-Arlington Heights, IL | ||||
| Median Metro Home Value: $217,500 | ||||
| Median Metro Population Density: 4,955 People per Square Mile | ||||
| Zip code | Neighborhood | Local Searches as a Share of All Searches | Median Home Value | Population
Density Difference from Metro Median |
| 60451 | New Lenox | 88.7% | $266,126 | -72.5% |
| 60448 | Mokena | 88.7% | $277,147 | -71.8% |
| 60491 | Homer Glen | 88.6% | $317,669 | -82.2% |
| 60463 | Palos Heights | 88.5% | $239,224 | -45.8% |
| 60441 | Lockport | 88.2% | $191,275 | -74.3% |
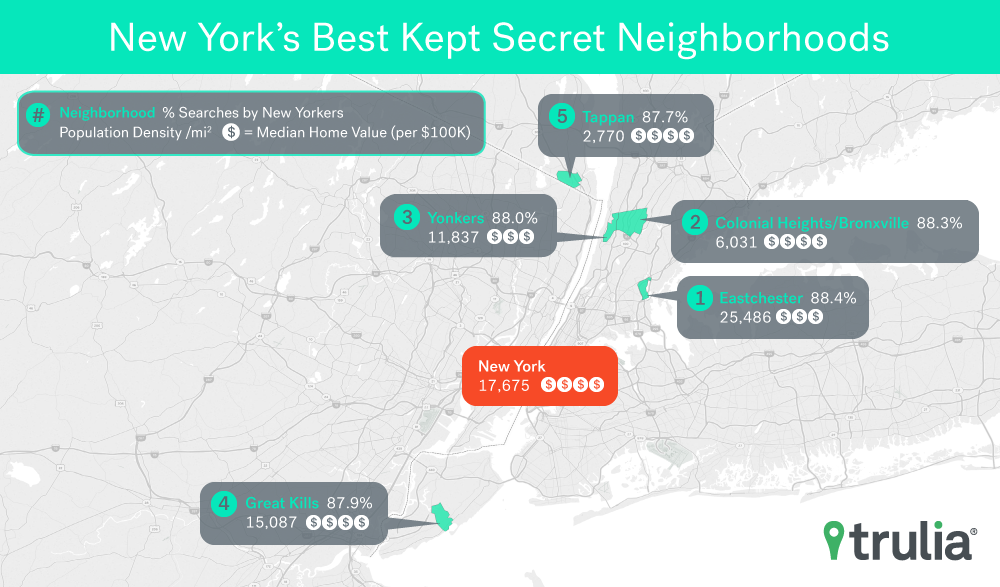
New York’s Close-In ‘Burbs
America’s biggest housing market, it’s no surprise locals want to search for homes in the Big Apple. New York is the fourth-most locally searched market in the U.S., at 76% of all searches. New York’s hippest neighborhoods – Williamsburg in Brooklyn, N.Y., Chelsea in Manhattan – are some of the most urban neighborhoods in the U.S. But when it came to places where locals searched and outsiders missed, suburban neighborhoods close-in to Manhattan ranked highest. Westchester County and the Hudson Valley ranked high in our results.
| New York-Jersey City-White Plains, NY-NJ | ||||
| Median Metro Home Value: $419,066 | ||||
| Median Metro Population Density: 17,675 People per Square Mile | ||||
| Zip code | Neighborhood | Local Searches as a Share of All Searches | Median Home Value | Population
Density Difference from Metro Median |
| 10475 | Eastchester | 88.4% | $373,556 | 44.2% |
| 10710 | Colonial Heights/Bronxville | 88.3% | $466,869 | -65.9% |
| 10703 | Yonkers | 88.0% | $397,337 | -33.0% |
| 10308 | Great Kills | 87.9% | $468,428 | -14.6% |
| 10983 | Tappan | 87.7% | $434,480 | -84.3% |
Atlanta: Beyond Decatur and Buckhead
Coming in right behind New York as the 5th most locally searched metro in the U.S., Atlanta is the least dense of the 10 markets we focused on. With 931 people per square mile, Atlanta is a city of suburbs with a small but vibrant central city. While Atlanta’s central neighborhoods are popular for outsiders looking to move to Atlanta, it’s Atlanta’s satellite cities, like Bremen, Whitesburg, and Carrolton that are most attractive to locals – and the places outsiders are likely to miss.
| Atlanta-Sandy Springs-Roswell, GA | ||||
| Median Metro Home Value: $183,869 | ||||
| Median Metro Population Density: 931 People per Square Mile | ||||
| Zip code | Neighborhood | Local Searches as a Share of All Searches | Median Home Value | Population
Density Difference from Metro Median |
| 30185 | Whitesburg | 86.0% | $104,042 | -93.4% |
| 30137 | Emerson | 85.4% | $123,235 | -60.2% |
| 30170 | Roopville | 85.3% | $114,833 | -92.2% |
| 30110 | Bremen | 84.7% | $100,700 | -80.1% |
| 30117 | Carrolton | 84.7% | $114,515 | -65.5% |
Beyond the City Limits in Austin
| Austin-Round Rock, TX | ||||
| Median Metro Home Value: $283,814 | ||||
| Median Metro Population Density: 1,291 People per Square Mile | ||||
| Zip code | Neighborhood | Local Searches as a Share of All Searches | Median Home Value | Population
Density Difference from Metro Median |
| 78613 | Cedar Park | 60.1% | $285,389 | 102.6% |
| 76574 | Taylor | 59.6% | $169,566 | -90.1% |
| 78660 | Pflugerville | 59.2% | $234,458 | 35.2% |
| 76578 | Thrall | 58.8% | $198,219 | -98.6% |
| 78652 | Manchaca | 58.7% | $310,424 | -76.0% |
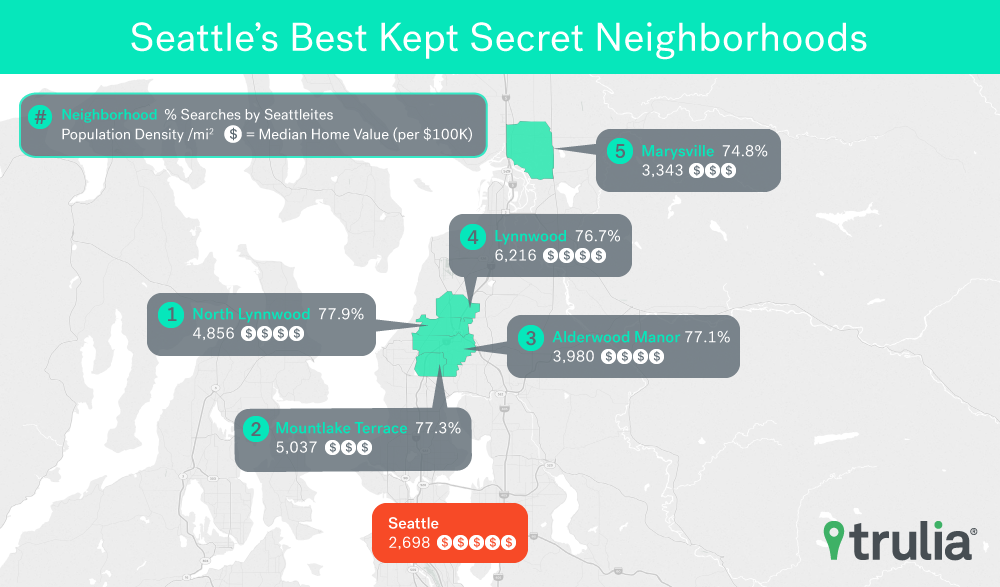
For Seattle Secrets, Look North
The Seattle housing market is among the nation’s hottest, in part because it has a 6.94% annual growth rate. While Seattle’s most renowned neighborhoods may be trendy, they’re trendy and expensive. All of the hip neighborhoods in Seattle are at least $100,000 more than the market median, with Capitol Hill being $500,000 above the median. Seattle natives seem to know how to be trendy and frugal; the most searched local neighborhoods ignored by outsiders are below market median, and two neighborhoods, Mountlake Terrace and Marysville, both to the north of Seattle, carry listing prices that are more than $100,000 less expensive than the average Seattle home.
| Seattle-Bellevue-Everett, WA | ||||
| Median Metro Home Value: $502,739 | ||||
| Median Metro Population Density: 3,460 People per Square Mile | ||||
| Zip code | Neighborhood | Local Searches as a Share of All Searches | Median Home Value | Population
Density Difference from Metro Median |
| 98037 | North Lynnwood | 77.9% | $438,418 | 80.0% |
| 98043 | Mountlake Terrace | 77.3% | $385,539 | 86.7% |
| 98036 | Alderwood Manor | 77.1% | $446,589 | 47.5% |
| 98087 | Lynnwood | 76.7% | $411,227 | 130.4% |
| 98270 | Marysville | 74.8% | $326,491 | 23.9% |
Hialeah Is Hot for Miami Locals
| Miami-Miami Beach-Kendall, FL | ||||
| Median Metro Home Value: $275,747 | ||||
| Median Metro Population Density: 4,512 People per Square Mile | ||||
| Zip code | Neighborhood | Percentage of Local Searches | Median Home Value | Population
Density Difference from Metro Median |
| 33013 | Hialeah | 71.1% | $261,042 | 98.8% |
| 33010 | Hialeah Park | 70.6% | $242,739 | 137.8% |
| 33012 | Hialeah Gardens | 70.1% | $183,511 | 188.2% |
| 33189 | Cutler Bay | 69.1% | $252,586 | 3.2% |
| 33165 | University Park | 68.9% | $340,354 | 66.5% |
Head South of San Francisco
If you’re looking to live in San Francisco, those housing prices might be painful to see. As one of the most expensive markets in the country, the plethora of jobs in San Francisco, which has an unemployment rate of 3%, the fourth-lowest in the country, demand for homes is at record highs. Locals, as opposed to outsiders, look more to places such as South San Francisco, which may offer relatively less painful prices and good neighborhoods. All of South San Francisco, as well as nearby Daly City, Brisbane, and San Bruno, are the hidden local gems, according to the data. Popular among locals, these neighborhoods offer median listing prices roughly $300,000 cheaper than the metro median.
| San Francisco-Redwood City-South San Francisco, CA | ||||
| Median Metro Home Value: $1,192,206 | ||||
| Median Metro Population Density: 10,238 People per Square Mile | ||||
| Zip code | Neighborhood | Local Searches as a Share of All Searches | Median Home Value | Population
Density Difference from Metro Median |
| 94080 | South San Francisco | 61.7% | $873,010 | -36.9% |
| 94066 | San Bruno | 61.1% | $938,667 | -32.2% |
| 94005 | Brisbane | 60.8% | $864,029 | -90.0% |
| 94015 | Westlake | 60.5% | $888,007 | 8.9% |
| 94014 | Daly City | 60.4% | $811,464 | -24.6% |
L.A.’s Angel Neighborhoods Are In San Fernando and Northridge
Los Angeles may be home to some glamorous neighborhoods, but they’re also expensive neighborhoods. The median values for these neighborhoods are about $250,000 more than L.A.’s already pricey median home value. If you want cheaper neighborhoods the locals love, look north of L.A. San Fernando and Northridge are neighborhoods, among others, that are popular with L.A. natives and missed by outsiders.
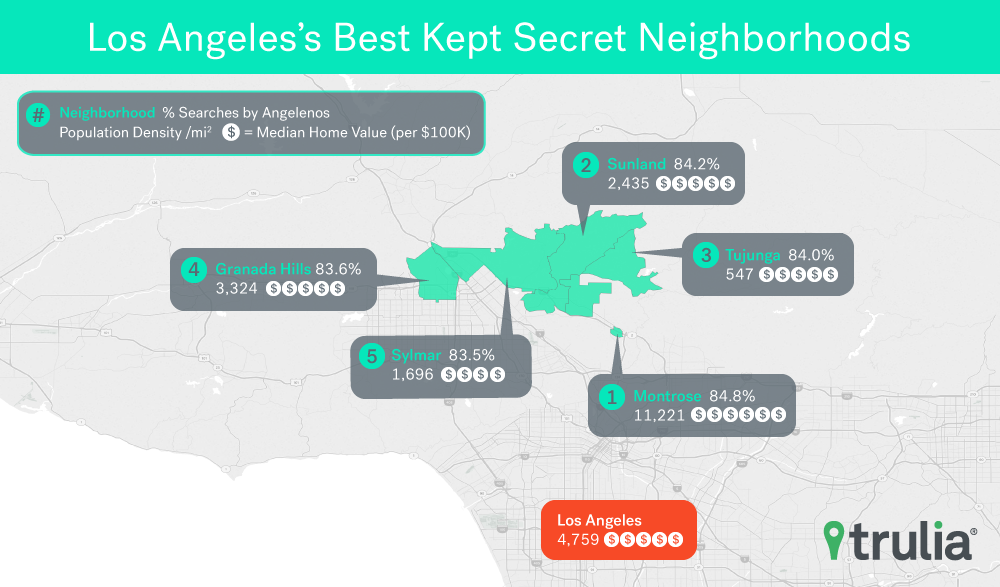
| Los Angeles-Long Beach-Glendale, CA | ||||
| Median Metro Home Value: $555,956 | ||||
| Median Metro Population Density: 4,759 People per Square Mile | ||||
| Zip code | Neighborhood | Local Searches as a Share of All Searches | Median Home Value | Population
Density Difference from Metro Median |
| 91020 | Montrose | 84.8% | $668,314 | 135.8% |
| 91040 | Sunland | 84.2% | $565,853 | -48.8% |
| 91042 | Tujunga | 84.0% | $577,675 | -88.5% |
| 91344 | Granada Hills | 83.6% | $591,904 | -30.1% |
| 91342 | Sylmar | 83.5% | $467,082 | -64.4% |
Boston’s Best Are on the Road to Brockton
While Boston’s trendiest neighborhoods can reach up to $400,000 above the market median, locals know where to find the affordable neighborhoods. If you’re looking for a more affordable place to live, and popular among the locals, look for the neighborhoods and towns between Brockton and the Interstate 3. This area, including the towns of Hanover, Rockland, Hansom, Abington and Pembroke are all extremely popular for locals, missed by out-of-towners and almost all below the market’s median home price.
| Boston, MA | ||||
| Median Metro Home Value: $428,953 | ||||
| Median Metro Population Density: 5,277 People per Square Mile | ||||
| Zip code | Neighborhood | Local Searches as a Share of All Searches | Median Home Value | Population
Density Difference from Metro Median |
| 2341 | Hanson | 72.5% | $369,474 | -86.9% |
| 2339 | Hanover | 71.8% | $472,623 | -82.7% |
| 2359 | Pembroke | 71.5% | $374,569 | -84.3% |
| 2351 | Abington | 71.1% | $327,435 | -68.4% |
| 2370 | Rockland | 71.0% | $297,779 | -67.5% |
Virginia is For Washingtonians
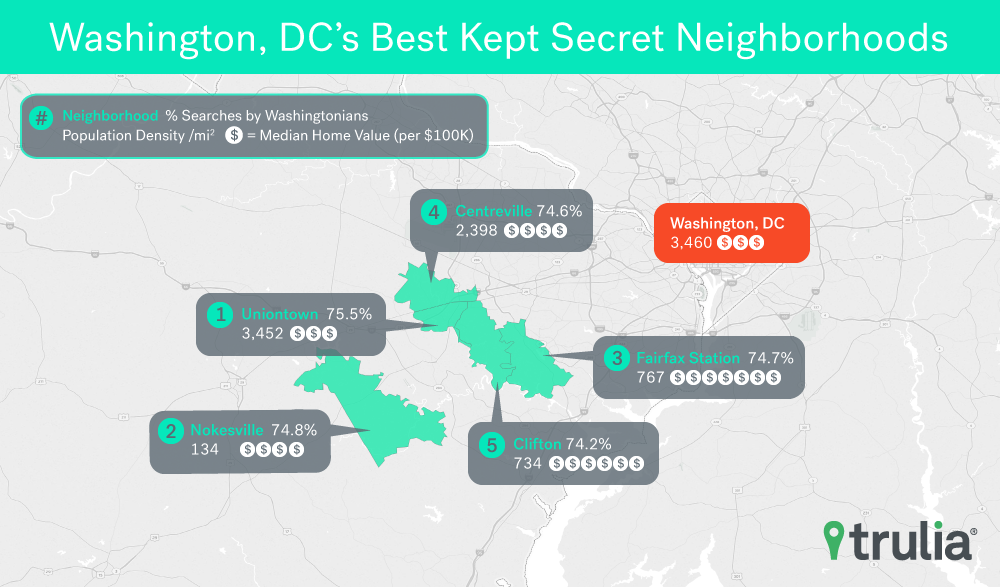
| Washington-Arlington-Alexandria, DC-VA-MD-WV | ||||
| Median Metro Home Value: $378022 | ||||
| Median Metro Population Density: 3,460 People per Square Mile | ||||
| Zip code | Neighborhood | Local Searches as a Share of All Searches | Median Home Value | Population
Density Difference from Metro Median |
| 20121 | Uniontown | 75.5% | $356,095 | -0.2% |
| 20181 | Nokesville | 74.8% | $439,893 | -96.1% |
| 22039 | Fairfax Station | 74.7% | $763,783 | -77.8% |
| 20120 | Centreville | 74.6% | $442,302 | -30.7% |
| 20124 | Clifton | 74.2% | $647,021 | -78.8% |
Methodology
We used Trulia search data between July 2016 and July 2017 to calculate the proportion of searches in a metro area that originated from within that same metro area to calculate the proportion of local searches. The proportion of local searches is the ratio of searches in an area originating from the same metro area to total searches in the area. Zip codes were used as a proxy for neighborhoods, and matched to whatever largest neighborhood or town in the zip code was. As these are not perfect boundary matches, there can be some deviation between these values and the full neighborhoods. Population growth was calculated using the difference in population between the 2011 and 2015 U.S. Census. Population Density is the total number of people living in a geographic area, divided by its land area. Census population values were used for these calculations. Trulia uses the Census defined metropolitan divisions where available; otherwise, we follow the metropolitan statistical area definitions.

