Gaming is more than just where you are in a virtual world – whether it be Azeroth or Runeterra — it’s where you are in the real one too. Fast internet speeds, plethora of local game and computer stores, and a peer age-group that lends itself to strong gaming social circles in your area are all important factors in having a legendary gaming experience.
At Trulia we’ve identified the best places to be a gamer, both for the casual players and those pushing to be the top of top in your game of choice. Partnering with Speedtest by Ookla, we analyzed internet speeds of the nation’s biggest metros. Then, we used our own data to find stores essential to gamers, likely gamer populations (based on age) and housing costs.
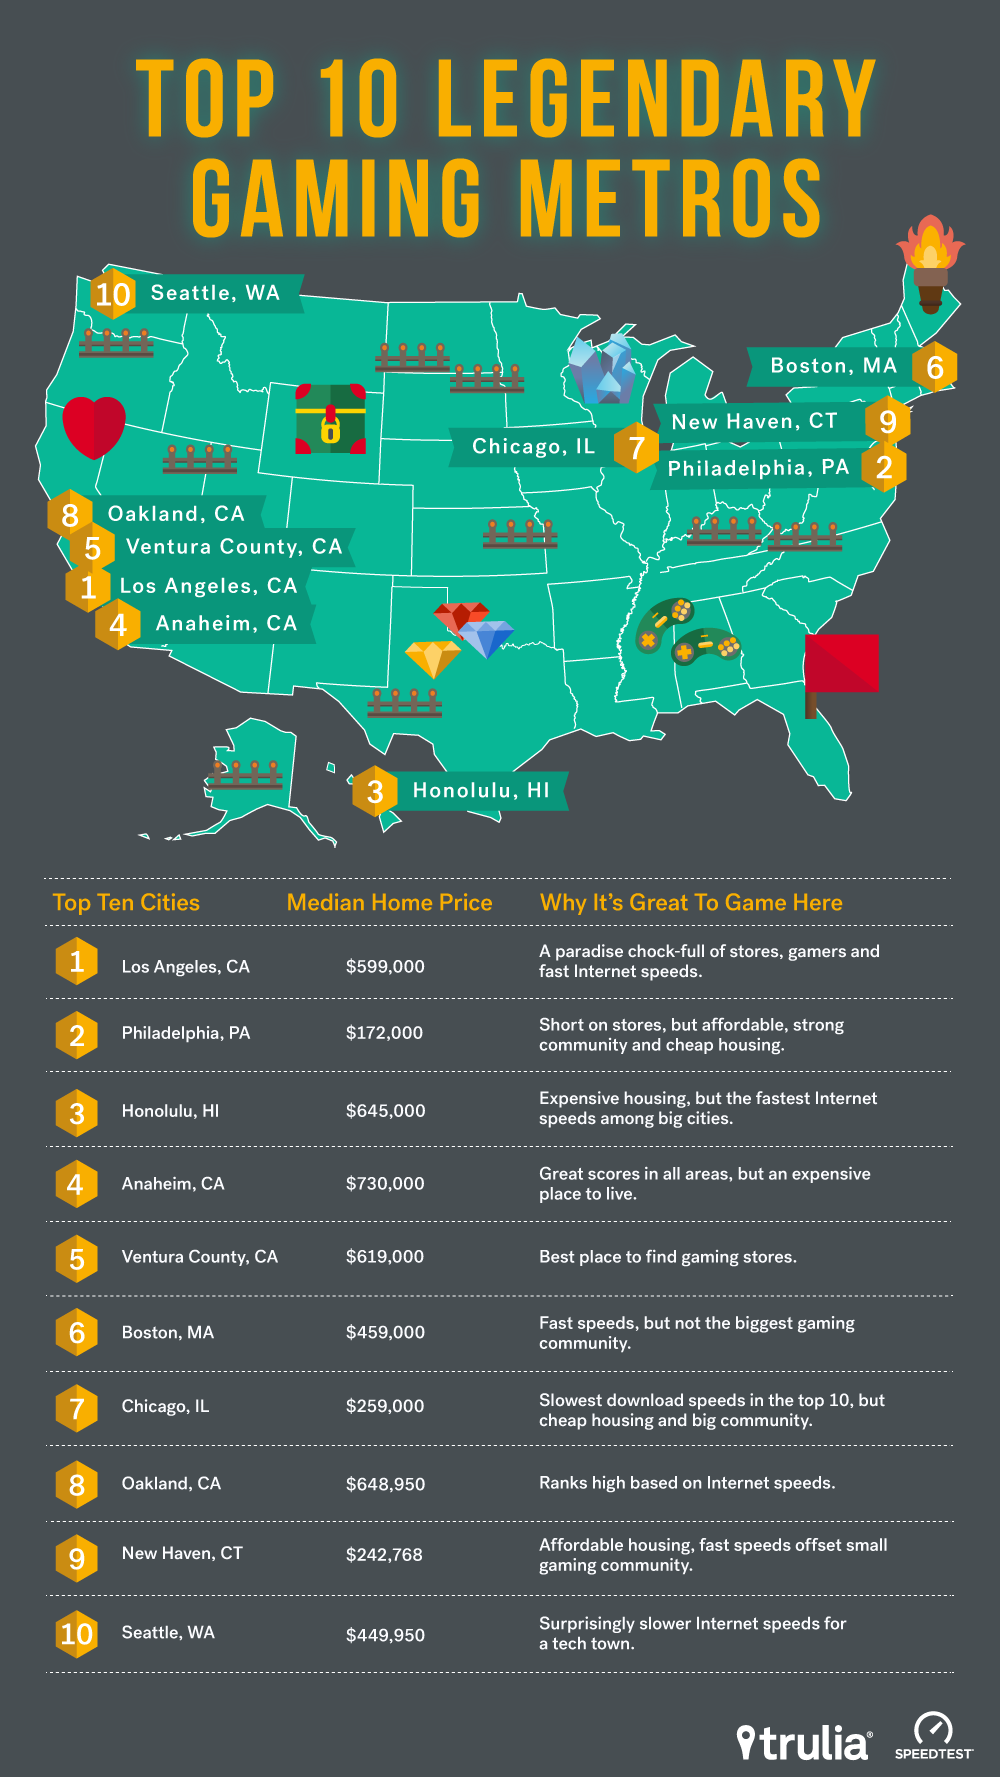
| The League of Legendary Gaming Cities | ||||||
| Metro | Store Index | Latency Score | Download Speed Score | Gamer Community Score | Home Price Score | Final Index |
| Los Angeles-Long Beach-Glendale, CA | 98 | 91 | 93 | 95 | 7 | 84.7 |
| Philadelphia, PA | 13 | 87 | 82 | 92 | 83 | 78.7 |
| Urban Honolulu, HI | 87 | 100 | 100 | 42 | 5 | 77.6 |
| Anaheim-Santa Ana-Irvine, CA | 97 | 97 | 95 | 48 | 3 | 77.2 |
| Oxnard-Thousand Oaks-Ventura, CA | 99 | 69 | 97 | 62 | 6 | 72.7 |
| Boston, MA | 68 | 96 | 92 | 40 | 13 | 72.5 |
| Chicago-Naperville-Arlington Heights, IL | 81 | 94 | 54 | 73 | 47 | 71.8 |
| Oakland-Hayward-Berkeley, CA | 89 | 82 | 94 | 44 | 4 | 70.9 |
| New Haven-Milford, CT | 74 | 74 | 90 | 34 | 54 | 68.8 |
| Seattle-Bellevue-Everett, WA | 76 | 84 | 73 | 55 | 14 | 67.1 |
Coming out on top is Los Angeles. L.A. ranks third in the collective stores category, has a 90th percentile download speed of 135mbps, an average 27ms latency, and is sixth for gamer demographics, Los Angeles is extremely tough to beat for an exceptional gaming experience, though a median listing price of $600,000 makes it an expensive home field. Still, it’s no surprise that some of the biggest gaming tournaments in the world are held in L.A., with League of Legends World Championships taking place for the second time in Los Angeles’ Staples Center.
Right behind was Philadelphia. The region is short of electronics stores but made up for it with fast Internet speeds: a respectable 112mbps and 29ms latency. It also ranked seventh for gamer ages. With the median listing price at only $172,000, Philadelphia is the ideal destination for the budget gamer.
Honolulu is also a great location for gaming. Local Internet speed is fast, hitting nearly 200mbps and a blazing fast 19ms. Real estate prices, however, are fairly steep with a median listing price of $645,000. The Honolulu metro, which has an unusually high population those aged 50 or older, also doesn’t trend young enough to match well with the current generation of likely gamers. That said, there are still plenty of gamers who hail from Hawaii. You might even get lucky and meet former TSM Top Laner Marcus “Dyrus” Hill, who hails from Honolulu
Speaking of major gaming tournaments, DOTA[1] 2’s International, located in Seattle, picked a great city to game in. Seattle ranked 10th on our list. Its top download speeds are 110 mbps and 30ms latency. Seattle is also home to two annual Penny Arcade eXpo (PAX) conventions, major events for anyone in the gaming world.
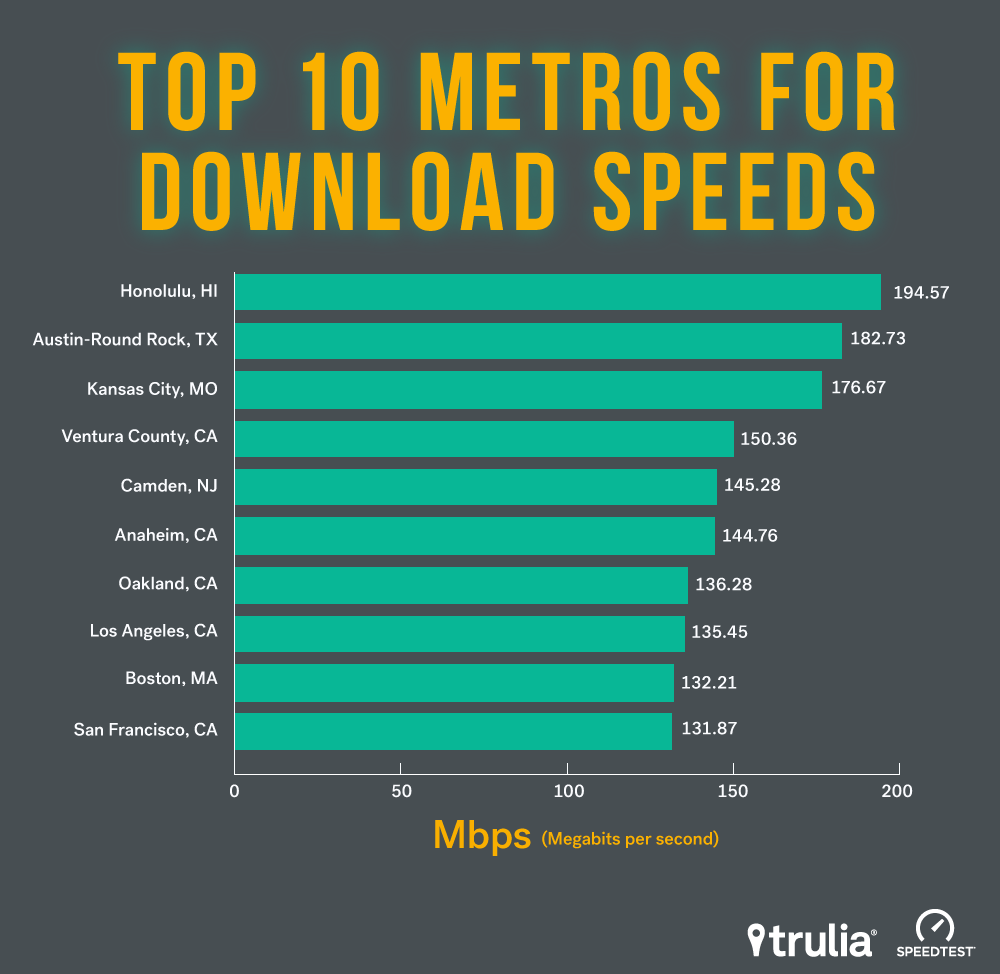
Other PAX locations include Boston and San Antonio, Texas, ranked sixth and 34th in our ranking, respectively. Boston’s another Internet speed powerhouse, with 132mbps in download speed and an outstanding 23ms average latency (ranked fifth overall for latency). If PAX is looking for a new place to host their PAX South, Austin, Texas, has the second highest download speed in the country, at 182mbps, and was ranked 11th for the amount of stores in the metro.
[1] Defense of the Ancients
Where Gaming-Related Businesses Thrive
For those who get a thrill walking into a store to buy games, check out computers and to test out the quality of peripherals such as joysticks, keyboards, headphones, look no further than California. The top five metros for gaming-related businesses per household are located in California, with San Jose on top, followed by Ventura County, Los Angeles, Anaheim, Calif., and San Francisco. It’s one thing to read reviews on sound quality for a set of headphones, or the DPI[1] on a mouse, but it’s completely different to go into a store to experience yourself.
San Jose is also home to the IEM San Jose tournament. The Intel Extreme Masters tournament is one of the best international tournaments for League of Legends and CSGO fans in the US.
[1] Dots per inch, a standard measure for mouse and cursor sensitivity.
Why Internet Speeds – Latency, Download and Upload – Matter
As almost every gamer knows, there are three main measures of internet speeds, of which two are most valuable for the typical gamer.
- Download speed, measured in Mbps (megabits per second) is how much raw information is being received per second. While not necessarily the most valuable stat while gaming, since most games tend to only send small amounts of information while playing, it’s a very important statistic for downloading games, or watching video streams of your favorite games.
- Latency, measured in ms (milliseconds), on the other hand, is how long it takes to send a message to a server and receive a response. The lower your latency, or “ping,” the faster your commands will be processed in game. If you’ve ever just barely failed to dodge something in game, chances are you might have been able to if your ping were just a bit faster.
- The last major internet speed metric is upload speed, or how much information you can send out at a time. This tends to be typically lower than download speed, and is only a statistic valuable for streamers in the gaming community. If you’re looking for fast upload speeds, the Kansas City metro is almost double the next highest, thanks to Google Fiber gigabit connections. Kansas City also ranked third for download speeds at 176 mbps at the 90th
- If you want to find the best provider in your area, the United States Speedtest Market Report ranks the fastest ISPs and carriers in many cities (note: Speedtest’s defined metro areas differ from those in this report).
Methodology
The index was calculated using the rankings of the largest 100 metro areas based on the following metrics.
First, the number of gaming related stores per occupied household. This includes computer stores, electronics stores, video game stores, and so forth, which was sourced from Yelp data.
Second, internet speed data from Speedtest by Ookla (including both download speed and latency). We relied on Speedtest’s expertise when ranking internet speeds, using their methodology to report download speeds on the ninetieth percentile and average latencies. These speeds were aggregated by Trulia’s defined MSAs
Third, gamer age demographics. We calculated how closely the ESA’s (Entertainment Software Association) 2016 Essential Facts’ gamer age-demographics matched the general population age-demographics. The general population age-demographics was calculated using U.S. Census 5-year 2014 American Community Survey data. Metros whose general population age-demographics more closely match its own gamer age-demographics have a better representation of gamers, such that gamers at all ages would have the best chance of finding other like-minded gamers their own age.
Finally, Trulia’s median home listing prices in August of 2016. We wanted to also consider the home affordability of these top 100 metro areas.
Rankings based on each of these metrics were weighted as follows in calculating the final, weighted-average index by which the top 100 metro areas were ranked: Gaming-related store per occupied household 10%, ninetieth percentile download speed 30%, average latency 30%, gamer vs general population demographics discrepancy 20%, and median home listing prices 10%. The ESA showed that just less than half of video game and related electronics are sold in physical stores, which is why the gaming-related stores were ranked fairly low. Trulia’s metro area definitions follow metropolitan divisions where available, then metropolitan statistical areas.

