
As the spring home buying season wound down in the second quarter, home seekers still on the hunt may have finally gotten some relief. Nationally, inventory was up 12.2% over the first quarter. This second-quarter rebound is the largest since 2015. Last year, the second quarter increase was a lukewarm 3.9%.
This seasonal inventory jump wasn’t enough to offset the historical year-over-year downward trend that has continued over 14 consecutive quarters, starting in the first quarter of 2015. Despite the second-quarter gain, inventory was down 5.3% from a year ago. Still, this represents an easing of the double-digit drops we’ve been seeing since the second quarter of 2017.
Examining housing trends across the nation through the second quarter of 2018, we found:
- Housing inventory grew 12.2% in the second quarter over the first quarter, the largest second-quarter spike since 2015.
- However, housing inventory continued its downward trajectory—inventory fell 5.3% year-over-year.
- Many of the nation’s most unaffordable metros experienced some unusual inventory relief, including New York and Los Angeles, where the supply of homes edged up 1% and 2.9% respectively year-over-year.
- Thirty of the nation’s 100 largest metros posted annual inventory increases in the second quarter, of which 25 rebounded from inventory decreases last year.
| 2018 Q2 National Inventory and Price Watch | |||
| Change from… | |||
| Metric | In 2018 Q2 | Last Quarter | Last Year |
| Inventory | 1,231,100 | 12.2% | -5.3% |
| Price | $275,000 | 4.8% | 5.8% |
| Affordability | 28.4% | 1.9 | 2.2 |
| Note: Inventory and price changes are percentage differences. Affordability changes are percentage point differences. | |||
Inventory Relief in Unaffordable Metros
Some of the nation’s least affordable and most inventory-starved metros saw a glimmer of hope in the second quarter. Of the 10 most unaffordable metros, six registered an inventory uptick.
| Most Unaffordable Metros | ||||||
| Metro | Inventory | Price | Affordability | |||
| Q2 2018 | YoY Pct. Change | Q2 2018 | YoY Pct. Change | Q2 2018 | YoY Pct. Pt. Change | |
| San Francisco, CA | 1,077 | -0.8% | $1,330,390 | 9.0% | 65.9% | 7.3 |
| New York, NY | 44,800 | 1.1% | $715,454 | 3.9% | 64.6% | 3.9 |
| Los Angeles, CA | 11,269 | 2.9% | $659,000 | 4.6% | 58.8% | 4.2 |
| Miami, FL | 19,528 | 3.1% | $398,900 | 3.6% | 54.6% | 3.0 |
| San Jose, CA | 1,322 | -3.8% | $1,099,000 | 22.2% | 54.2% | 11.2 |
| Anaheim, CA | 5,572 | 0.4% | $799,000 | 5.3% | 52.7% | 4.1 |
| San Diego, CA | 5,911 | 22.1% | $649,833 | 8.5% | 50.7% | 5.3 |
| Ventura, CA | 1,537 | 13.3% | $649,950 | 0.5% | 44.9% | 1.5 |
| Oakland, CA | 2,401 | -3.7% | $719,426 | 5.1% | 44.4% | 3.3 |
| Boston, MA | 4,045 | 0.0% | $558,429 | 5.9% | 42.0% | 3.3 |
In New York, where the median household must spend 65% of its income to buy a home, inventory notched a 1% increase over last year—a small change to be sure, but still the first inventory growth the metro has experienced since the third quarter of 2015.
Similarly, Los Angeles, requiring 59% of a median household’s income to purchase a home, posted 3% year-over-year inventory growth. That’s that metro’s first gain in home supply since the first quarter of 2015.
Among these unaffordable metros, San Diego posted the largest inventory growth—22% year-over-year. Compare that with the same quarter last year, when that Southern California metro registered a 28% inventory decrease.
This inventory growth is heartening, but it hasn’t stopped the relentless march of unaffordability. More properties may be on the market, but the upward creep of prices and mortgage rates is putting homes in these metros further out of reach. More inventory may be helping to cool off the bidding wars in these areas, but homebuyers are getting no relief from the unaffordability squeeze.
Inventory Rebounds
| 10 Metros with Largest Inventory Growth | ||
| Metro | Q2 2018 YoY Pct. Change |
Q2 2017 YoY Pct. Change |
| Nashville, TN | 52.0% | -11.6% |
| Salt Lake City, UT | 48.6% | -16.0% |
| Fort Worth, TX | 34.8% | -8.9% |
| Dallas, TX | 32.4% | 12.7% |
| Greensboro, NC | 23.2% | -21.4% |
| San Diego, CA | 22.1% | -27.8% |
| Washington, DC | 21.9% | -19.5% |
| Portland, OR | 21.5% | 1.9% |
| Silver Spring, MD | 16.2% | -14.8% |
| Little Rock, AR | 13.4% | -22.2% |
In total, 30 of the 100 largest metros posted annual inventory gains in the second quarter, and 25 of those 30 were rebounding from inventory decreases last year. Notably, the two metros leading this pack of 25—Nashville, Tenn. and Salt Lake City—built more than their historic averages in 2017. That extra construction appears to have paid off. Nashville posted a 52% inventory surge in the second quarter, compared with an 11.6% decrease in the second quarter last year. Similarly, Salt Lake City, with a 48.6% second-quarter inventory increase, rebounded from a 16.0% decrease last year.
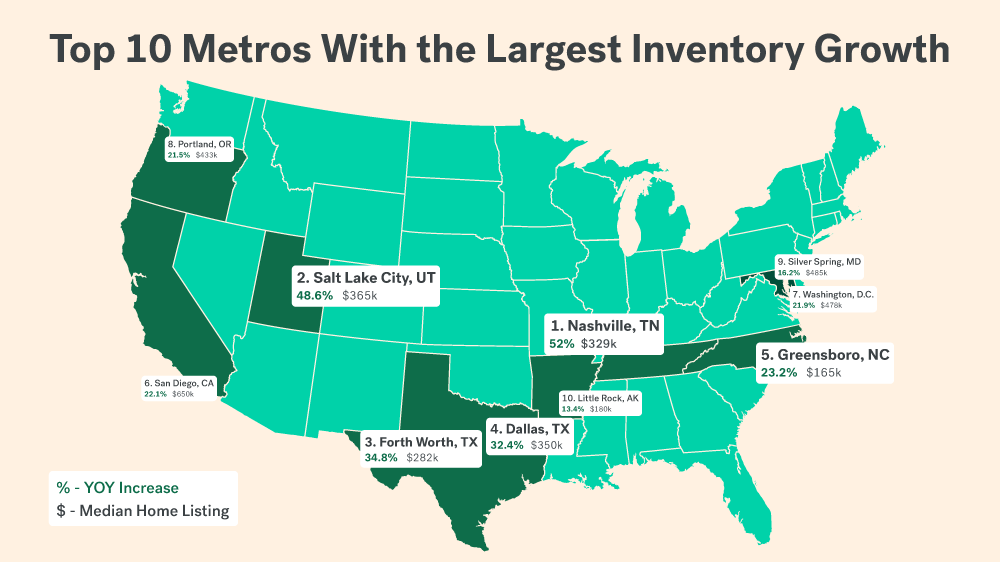
Top 10 markets where housing inventory is rising
The End of the Season
This second-quarter inventory spike, especially in some of the nation’s most unaffordable metros, offered much-needed good news for homebuyers still looking for their dream home. And even though inventory dropped 5.3% year-over-year, that represented a marked slowdown from the double-digit dives inventory had been taking in the past four quarters—including that 12.2% plunge in the first quarter. Still, in many metros, it will take more sustained growth to alleviate the inventory shortage.
Methodology
This version of our inventory report makes several methodological changes compared with previous versions. Previous inventory and price metrics are not comparable with this version.
For our inventory metrics, we take a snapshot of listings each Wednesday in the middle month of the quarter. Quarterly inventory totals are based on the median of the count each Wednesday. Price is based on the median listing price of every active listing throughout the month. We measure affordability as the share of income needed to purchase the median-priced home, assuming a 20% down payment and the average 30-year fixed mortgage rate in each quarter as quoted by Freddie Mac in its Primary Mortgage Market Survey (PMMS). Household incomes are pulled from 1-Year American Community Survey (ACS) microdata. We inflation-adjust 2016 incomes to later quarters. We use 2016 5-Year ACS data to estimate property taxes and insurance rates.

