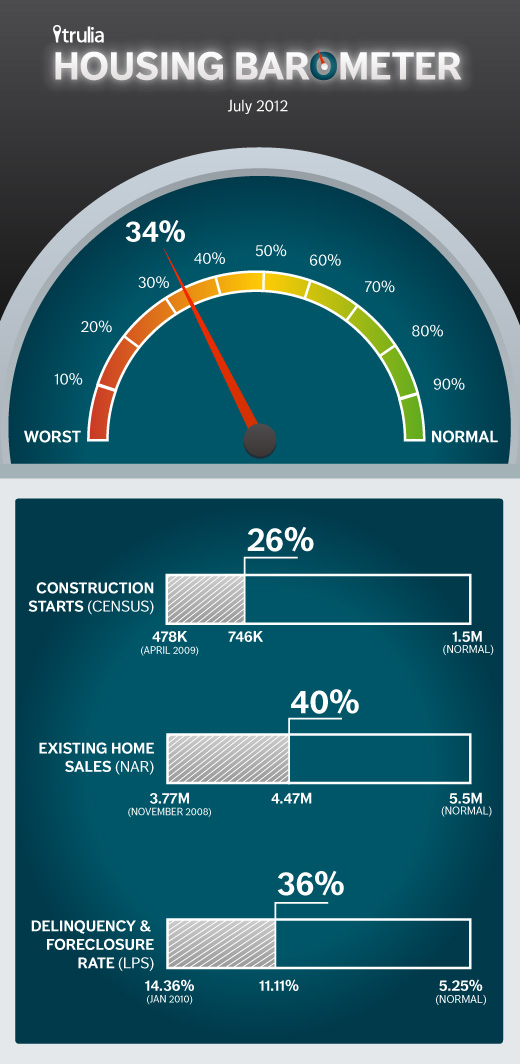
Each month Trulia’s Housing Barometer charts how quickly the housing market is moving back to “normal.” We summarize three key housing market indicators: construction starts (Census), existing-home sales (NAR) and the delinquency-plus-foreclosure rate (LPS First Look). For each indicator, we compare this month’s data to (1) how bad the numbers got at their worst and (2) their pre-bubble “normal” levels.
In July 2012, construction starts held more or less steady, while home sales rose and the delinquency + foreclosure rate fell:
—Construction starts held roughly steady. Starts in July were at a 746,000 annualized rate, down 1.1% month over month but up 21.5% year over year. Construction activity is back to normal levels in Austin, Houston and San Jose, but far below normal levels in Chicago, Detroit and Sacramento. Nationally, construction starts are 26% of the way back to normal.
—Existing home sales rebounded somewhat. Although home sales rose from 4.37 million in June to 4.47 million in July, they’re still at the second-lowest level of the year with tighter inventory and lower vacancy rates holding back sales. Right now, home sales are 40% back to normal to from their worst point during the bust.
—The delinquency + foreclosure rate went down. In July, 11.11% of mortgages were delinquent or in foreclosure, after jumping up to 11.23% in June. Even though many judicial-foreclosure states like Florida, New Jersey, Illinois and New York still have a large pipeline of foreclosures to work through, the delinquency + foreclosure rate nationally is 36% back to normal.
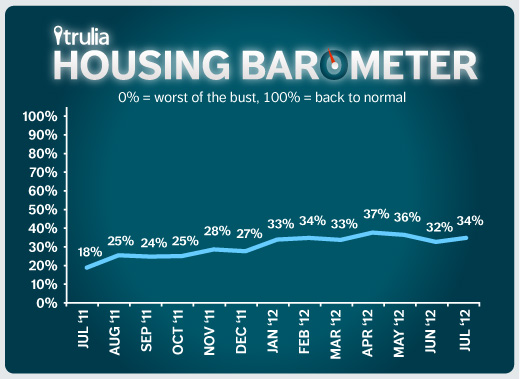
Averaging these three back-to-normal percentages together, the market is now 34% of the way back to normal – up a bit from 32% in June, and well up from 18% in July 2011. If the housing market continues to move back to normal at the rate we’ve seen over the past year, we’ll be back to normal in late 2016.


