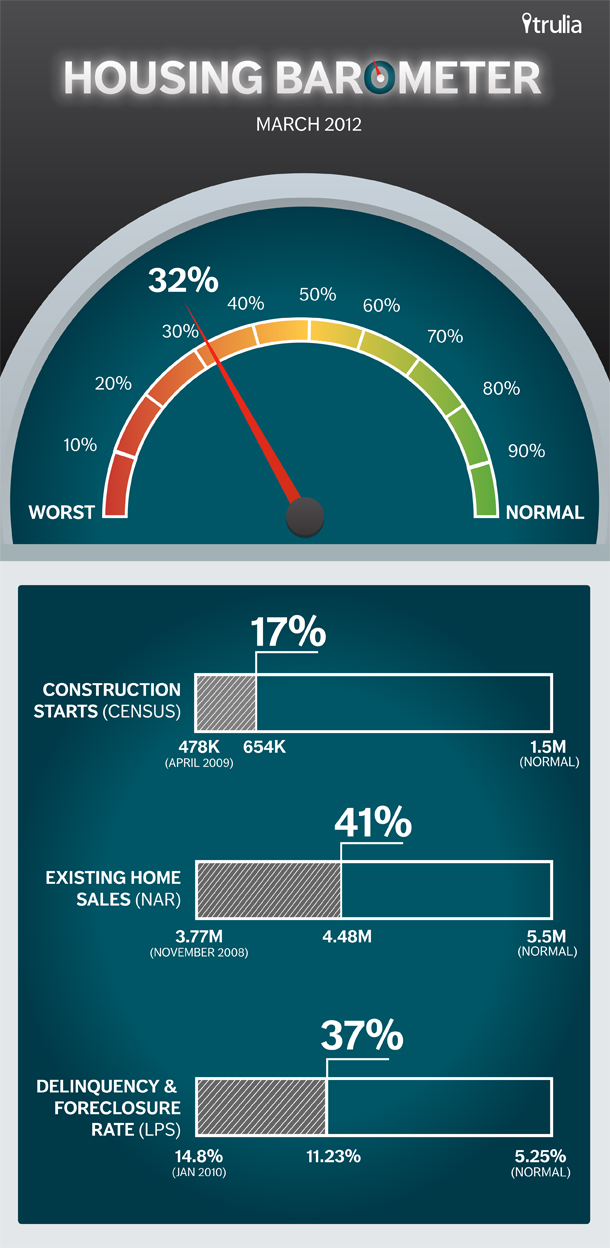
What does a “normal” housing market look like, and how far away are we? To figure this out, each month Trulia’s Housing Barometer summarizes three key housing market indicators: new construction starts (Census), existing-home sales (NAR) and the delinquency-plus-foreclosure rate (LPS First Look). For each indicator, we compare this month’s data to (1) how bad the numbers got at their worst and (2) their pre-bubble “normal” levels.
March data, released over the past few days, showed:
—Construction starts slipped in March. The decline in annualized starts from 694,000 to 654,000 pushed starts from 21% of the way back to normal in February down to just 17% in March.
—Existing home sales also slipped, from 4.60 million to 4.48 million. Home sales fell from 48% of the way back to normal in February to 41% in March.
—The delinquency + foreclosure rate improved. (Remember, on this measure, lower is better.) In March, 11.23% of mortgages were delinquent or in foreclosure, versus 11.70% in February, which means that this measure improved from 32% back to normal in February to 37% in March. As we learned from Truila’s December 2011 consumer survey, this is key for consumer confidence: 47% of Americans said fewer defaults and foreclosures would give them confidence that the housing market is getting back on track – more than any other indicator of recovery.
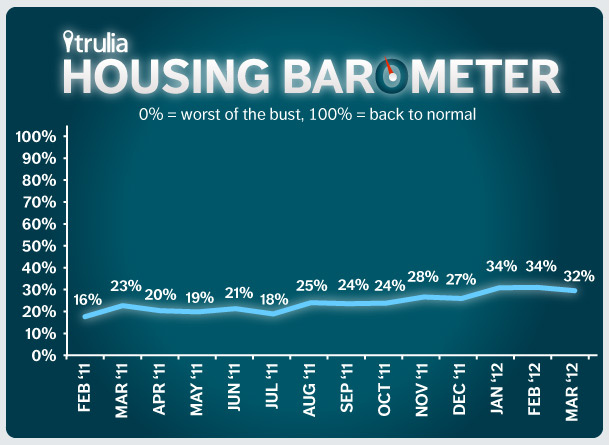
Averaging these three back-to-normal percentages together, the market is now 32% of the way back to normal. That’s a bit lower than in January and February, when the market was 34% of the way back to normal, but still higher than it was in 2011. In fact, the market was only 23% of the way back to normal this time last year.
Bottom Line: The housing recovery is progressing, though it’s taken one step backwards after a few strides forward.


