
Together, just three Texas markets – Dallas, Houston, and Austin – are on pace to build nearly 130,000 new homes in 2017 – an amount that would be more than 10% of all permits in the U.S., and nearly as much as 50 other large U.S. metros combined. Meanwhile, several markets in the Northeast will struggle to break ground on just 500 this year. Job, income, and home price growth separate those metros that are building more than their historical share from those that aren’t.
Homebuilding matters more than you might think. Not only are newly built homes a source of new home inventory as well as construction jobs, they also help increase existing inventory through a chain-reaction effect: buyers of new homes often sell their existing one, which frees up a home for someone else, who in turn decides to buy it and sell their home, which then becomes a home for a first-time homebuyer. In fact, last month we found that new homebuilding was the single best predictor of home inventory in the U.S.
So, if homebuilding can help ease housing shortages, why are some markets hot and others not? We dug into this question, and found that:
- Homebuilding activity varies widely among the largest metros. Dallas, Houston, and New York are each on pace to build more than 40,000 new homes each this year, while Worcester, Mass., New Haven, Conn., and Allentown, Pa., are pace to build less than 500 each.
- Markets that are building much more than their historical average are mostly in the South: Austin, Texas, Charleston, S.C., and Nashville, Tenn., are on track to finish 2017 having approved 107.7%, 72.8%, and 65.8% more residential construction than their historic average.
- Markets that are building much less than their historical average are mostly in the North: Worcester, Allentown, and New Haven are on track to finish 2017 having approved just 85.5%, 85%, and 80.8% fewer homes than their historic average.
- Strong job growth, increasing wages, and home value growth explain much of the difference between metros that are building more than their historical average and metros that aren’t.
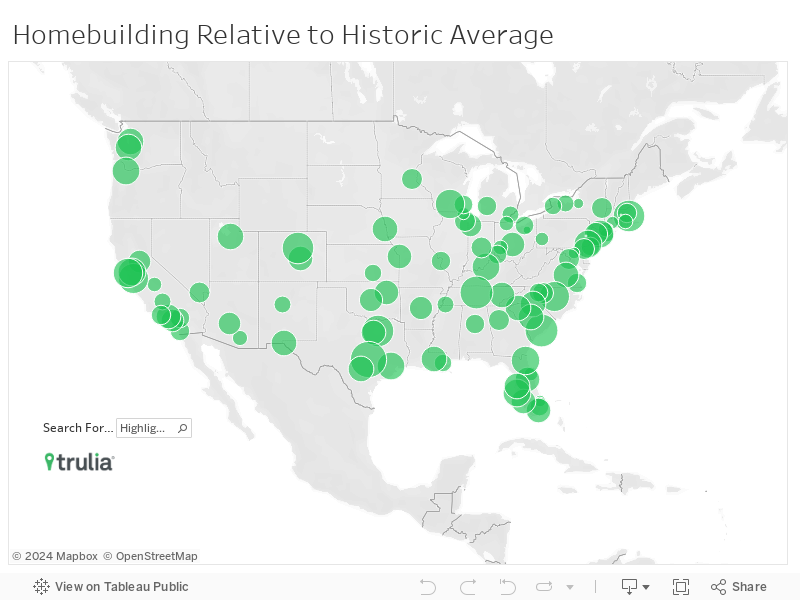
We analyzed census data building permit data to analyze how housing metros are building, both in total and relative to their historical average (see methodology below for details). Of course, the historical level of construction ranges from a lot in places like Houston and Phoenix, to very little in places like San Francisco and Detroit, but we’re not only looking at how many new homes these metros will build this year, but how much each metro’s 2017 construction activity is above or below its own historical average. Here’s where homebuilding in America is booming and busting.
Sheer homebuilding strength has a lot to do with market size. Some markets build a lot of homes just because they’re big (New York and Los Angeles, for example) while some build few because they’re small (Syracuse, N.Y., and Toledo, Ohio, for example). If we compare homebuilding in each metro relative to their historic average, Austin, Charleston, and Nashville are on track to build 107.7%, 72.8%, and 65.8% more in 2017 than their local historical average, the most of the largest 100 metros. The rest of the top 10 building more than their historical average are mostly in the South and West, including Dallas, Denver, San Francisco, and San Jose, Calif., with only Boston and Philadelphia being the only northeastern metros to make the list. Of course, the normal level of construction in many of these markets – particularly Boston, San Francisco, and Philadelphia – is low relative to most other metros across the country, but in 2017 they’re on pace to outperform their own historical norm.
| Metros Building More than their Historical Average | ||||
| U.S. Metro | 2017 annualized permit activity relative to metro historical norm | 2017 annualized permit activity | Average number of annual permits, 1980-2016 | Post-Recession % Home Value Change |
| Austin, TX | 107.7% | 29,872 | 14,379 | 29.7% |
| Charleston, SC | 72.8% | 8,722 | 5,048 | 31.8% |
| Nashville, TN | 65.8% | 19,622 | 11,833 | 34.1% |
| Philadelphia, PA | 62.3% | 3,794 | 2,338 | 11.9% |
| Boston, MA | 61.0% | 7,864 | 4,885 | 26.2% |
| Dallas, TX | 61.0% | 48,772 | 30,298 | 53.5% |
| Denver, CO | 56.2% | 25,098 | 16,071 | 56.3% |
| San Jose, CA | 54.9% | 9,224 | 5,956 | 62.6% |
| Raleigh, NC | 46.7% | 14,952 | 10,189 | 24.7% |
| San Francisco, CA | 41.9% | 4,570 | 3,221 | 63.4% |
| NOTE: Among 84 of the largest 100 U.S. metro areas with complete monthly permit reporting. Full data is available here. | ||||
In contrast, construction activity is lowest relative to the local norm in Worcester, Allentown, and New Haven which are on track to build 85.5%, 85%, and 80.8% less in 2017 than their local historical average. The rest of the bottom 10 are mostly in the Northeast and Midwest, including Akron, Ohio, Syracuse, N.Y., and Hartford, Conn., with only West Palm Beach, Fla., Daytona Beach, Fla., and Honolulu as the metros outside of the Rust Belt to make the list. Of course, the normal level of construction in many of these markets – particularly Akron and Syracuse – is low relative to most other metros across the country, but in 2017 they’re on pace to vastly underperform their own historical norm.
| Metros Building Less than their Historical Average | ||||
| U.S. Metro | 2017 annualized permit activity relative to metro historical norm | 2017 annualized permit activity | Average number of annual permits, 1980-2016 | Post-Recession % Home Value Change |
| Worcester, MA | -85.5% | 458 | 3,150 | 16.2% |
| Allentown, PA | -85.0% | 436 | 2,908 | 4.8% |
| New Haven, CT | -80.8% | 438 | 2,285 | 3.5% |
| Akron, OH | -77.1% | 530 | 2,314 | 10.7% |
| Syracuse, NY | -70.8% | 500 | 1,710 | 4.4% |
| West Palm Beach, FL | -66.4% | 3,670 | 10,915 | 59.9% |
| Hartford, CT | -63.8% | 1,338 | 3,698 | 0.8% |
| Lake County-Kenosha County, IL-WI | -62.8% | 1,414 | 3,804 | 18.1% |
| Deltona-Daytona Beach-Ormond Beach, FL | -61.4% | 1,894 | 4,909 | 43.1% |
| Honolulu, HI | -60.6% | 1,158 | 2,937 | 25.8% |
| NOTE: Among 84 of the largest 100 U.S. metro areas with complete monthly permit reporting. Full data is available here. | ||||
Dallas, Houston, and New York Contenders to Win Homebuilding Race
When it comes to sheer homebuilding activity, the Dallas, Houston, and New York metro areas are the top contenders to win this year’s homebuilding gold medal. Each is on track to permit more than 40,000 homes this year. Together, just three Texas metros – Dallas, Houston, and Austin – are on pace to build nearly 130,000 new homes in 2017. That would be more than 10% of all permits in the U.S., and more than 50 other large U.S. metros combined. Dallas leads the pack with nearly 49,000 projected permits, with Houston as a close second at nearly 48,000 permits. New York rounds out the top three, with a projection of just over 40,000. Bringing up the rear is Allentown, Hew Haven and Worcester, metros on track to build just 436, 438, and 458 new homes, respectively.
| Metros Building the Most and Least in 2017 | |||
| Markets on Pace to Build the Most in 2017 | Markets on Pace to Build the Least in 2017 | ||
| U.S. Metro | 2017 annualized permit activity | U.S. Metro | 2017 annualized permit activity |
| Dallas, TX | 48,772 | Allentown, PA | 436 |
| Houston, TX | 47,946 | New Haven, CT | 438 |
| New York, NY | 40,006 | Worcester, MA | 458 |
| Austin, TX | 29,872 | Syracuse, NY | 500 |
| Phoenix, AZ | 29,280 | Akron, OH | 530 |
| Denver, CO | 25,098 | Toledo, OH | 770 |
| Los Angeles, CA | 21,770 | Dayton, OH | 1,042 |
| Orlando, FL | 20,560 | Fairfield County, CT | 1,138 |
| Tampa-St. Petersburg, FL | 20,068 | Honolulu, HI | 1,158 |
| Nashville, TN | 19,622 | Hartford, CT | 1,338 |
| NOTE: Among 84 of the largest 100 U.S. metro areas with complete monthly permit reporting. Full data is available here. | |||
Why is Homebuilding Booming in Some Areas? Employment, Income, and Price Growth
A natural question to ask: why are some markets building more relative to their historical average than others? As it turns out, the factors that most explain the variation in homebuilding activity across the 100 largest metros are employment growth, income growth, and home price growth. We tested to see how strong the relationship was between these factors and homebuilding (see below for detailed methodology), along with two other measures that might explain homebuilding: post-recession changes in the residential vacancy rate, and post-recession levels of housing density. We included the latter two because, all else equal, increases in the vacancy rate and high levels of housing density should make it more challenging for homebuilders to build. However, it turns out that after controlling for the effects of job, income, and house price growth, these two don’t have a statistically meaningful relationship with homebuilding.
| Homebuilding Model Results | |
| For every percentage point increase in… | …there is a __ change, on average, in permitting activity across the 100 largest metros. |
| Job Growth | 5% |
| Income Growth | 2.1% |
| Home Price Growth | 1.2% |
| Home Price Growth2 | -0.02% |
| Home Price Growth/Income Growth | -0.9% |
| See methodology section for more details on our model. | |
First, the factor with the largest impact is job growth, which we measured as the rate at which a market added jobs between 2010 and 2016. Job growth is not only key for supporting a healthy housing market but also for supporting healthy homebuilding. Jobs provide a steady source of income that lenders usually require as a condition of financing. So, more jobs lead to more demand for homes, which in turn supports new homebuilding activity. Across the largest 84 metros, every percentage point increase in a market’s job growth between 2010 and 2016 is, on average, correlated with homebuilding that is approximately 5% higher. For example, if the Charleston, S.C., metro area had experienced job growth of 16.9% instead of 15.9% between 2010 – 2016, we could have expected their 2017 homebuilding activity to be 77.9% above their historic average instead of 72.9%.
The factor with the second largest correlation is income growth, which we measure as the percentage increase in median household income between 2010 and 2016. Even after taking into account the impact of job growth, income growth also helps bolster homebuilding. This is likely for two reasons: (1) housing is a normal good, which means as people earn more money they tend to buy more or better quality homes, and (2) new homes are more expensive than existing ones, so gains in income might allow existing homeowners to trade up to new homes. Across the largest 100 metros, every percentage point increase in income growth is, on average, correlated with homebuilding that is 2.1 percentage points higher than the metro’s historic average. For example, if the median income in the Portland, Ore., metro area grew by 18.6% instead of 17.6% between 2010 – 2016, we could have expected their 2017 homebuilding activity to be 30.3% above their historic average instead of 28.2%.
Last, home price appreciation is positively correlated with homebuilding activity across the largest U.S. metros. Price appreciation is important because of the law of supply: as the price of goods increase, suppliers will tend to supply more of it. We measure home price appreciation as the percentage increase in the median home value between 2010 and 2016, and found that every percentage point increase in home price appreciation is, on average, correlated with homebuilding that is 1.2% higher. However, we also found that unfettered price appreciation isn’t good for homebuilding either. In fact, we estimate that post-recession price gains up to 24% were positively correlated with homebuilding, but over that amount price gains were actually correlated with less homebuilding activity. Why is this? It’s tough to say for certain, but large price gains may do two things that discourage building: (1) they may drive up the price of land, which makes it costlier for builders to build, and (2) as price gains outpace incomes, all homes (especially new ones) become further out of reach of homebuyers.
Takeaways
Three of the nation’s largest housing markets – Dallas, Houston, and New York – are on pace to win the homebuilding race of 2017, but that’s mostly because they are just big. If we look at homebuilding activity relative to historic norms, Austin, Charleston, and Nashville are on track to finish the year with most. However, not all U.S. markets are going through a building boom: Worcester, Allentown, and New Haven will struggle to build more than 500 new housing units each this year. Finally, we found that much of the difference between markets that are building a lot relative to their historic average and those that building little can be explained mostly by differences in job, income, and home price growth.
Methodology
We utilized census building permit data on the number of permits issued annually between 1980 and 2016, and for the first half of 2017. Using the latter, we projected the level of building permits for the full year of 2017 for each metro, and compared with other markets as well as each metro’s own historical annual average level of building permits from 1980 to 2016.
We tested for the impact of five factors on homebuilding activity using a multiple linear regression, which is a statistical method used to test for correlation between several variables (factors) on an outcome of interest. Multiple linear regression methods allow us to estimate the impact of several factors on homebuilding activity while taking into account the individual effect of the other factors. We used an Ordinary Least Squares (OLS) regression with robust standard errors to predict how each factor would affect homebuilding across the 84 largest metros when controlling for the potential effects of the others. Our measure homebuilding is the number of projected residential permits in 2017 divided by each metro’s average number of annual permits between 1980 – 2016. In doing this, we standardize homebuilding levels by each market’s historic average.
We quantitatively measure each factor is as follows:
- Job growth: percent increase in employed persons between 2010 – 2016 from the Bureau of Labor Statistics;
- Income growth: median income growth between 2010 – 2016, 2015 American Community Survey (inflation adjusted to predict 2016 values)
- Three measures of home price growth:
- Percent increase in median home price growth, January 2010 – July 2016, using Trulia Home Value estimates;
- Percent increase in median home price growth squared, included so that we don’t restrict the impact of price growth to being linear;
- Percent increase in home price growth divided by percent increase in median income to pick up affordability effects.
- Vacancy rate change: the percentage point change in the United States Postal Service’s Deliver Statistics for residential properties between July 2010 and July 2016;
- Housing density: the number of occupied housing units in 2010 divided by the total metro land area, from the 2010 Decennial Census.
Below is a table of our regression results.
| Regression Model Results | |
| Variable | Coefficient (T-Value) |
| Job Growth, 2010 – 2016 | 0.0498 (4.82)* |
| Income Growth, 2010 – 2016 | 0.0209 (3.08)* |
| Home Price Growth, 2010 – 2016 | 0.0121 (1.37) |
| Home Price Growth2 | -0.0002 (-2.01)* |
| Home Price Growth/Income Growth, 2010 – 2016 | -0.0094 (-2.66)* |
| Vacancy Rate Change, 2010 – 2016 | 0.0314 (0.96) |
| Housing Density, 2010 | 0.0001 (1.08) |
| Diagnostics | |
| R2 | .51 |
| Observations | 84 |
| NOTE: *Denotes statistical significance at the < 5% confidence level. The dependent (outcome) variable is each metro’s homebuilding activity in 2017 relative to its historic average. A joint significance test between house price growth and its quadratic term was significant at the <1% confidence level. The full data used in the regression model is available for download here. | |

